Twenty thousand contracts at 10:00 could be huge or ordinary, the read depends on what the rest of today has looked like. The indicator builds a running average of every bar in today's session from 09:35 onward and expresses the current bar as a multiple of that baseline. A 2.0× reading means twice today's cumulative average, computed fresh every session. Color-coded thresholds show conviction at a glance; an optional Volume Efficiency filter separates absorption from clean momentum.
Or get all 12 in the Complete Bundle · $299 · see pricing →
NQ 03-26
1m5m15mRTH
O 25722.00H 25774.00L 25712.00C 25772.00
● NinjaTrader 8 Workspace · RVol LoadedCME Globex · Live
Every bar,
against
the running session.
Raw volume is meaningless alone. Twenty thousand contracts at 10:30 could be huge or ordinary, it depends on what the rest of today has looked like. The indicator builds a running average from 09:35 ET onward, summing every bar's volume as it prints and dividing by the bar count. Each new bar's volume is then expressed as a ratio to that running average: gray below 1.5×, gold between 1.5× and 2.0×, red above 2.0×. No lookback to prior days, no time-of-day comparison, just today's bar against today's developing session. The 09:40 display delay lets the baseline accumulate enough data to be trustworthy.
The indicator, in the
wild.
Three live MNQ sessions, three timing relationships between volume and price, volume firing first, volume sustained through the move, and volume vanishing after the climax.
Volume leads,
price follows.
MNQ 06-26 · RTH · 1mNinjaTrader 8 · live session
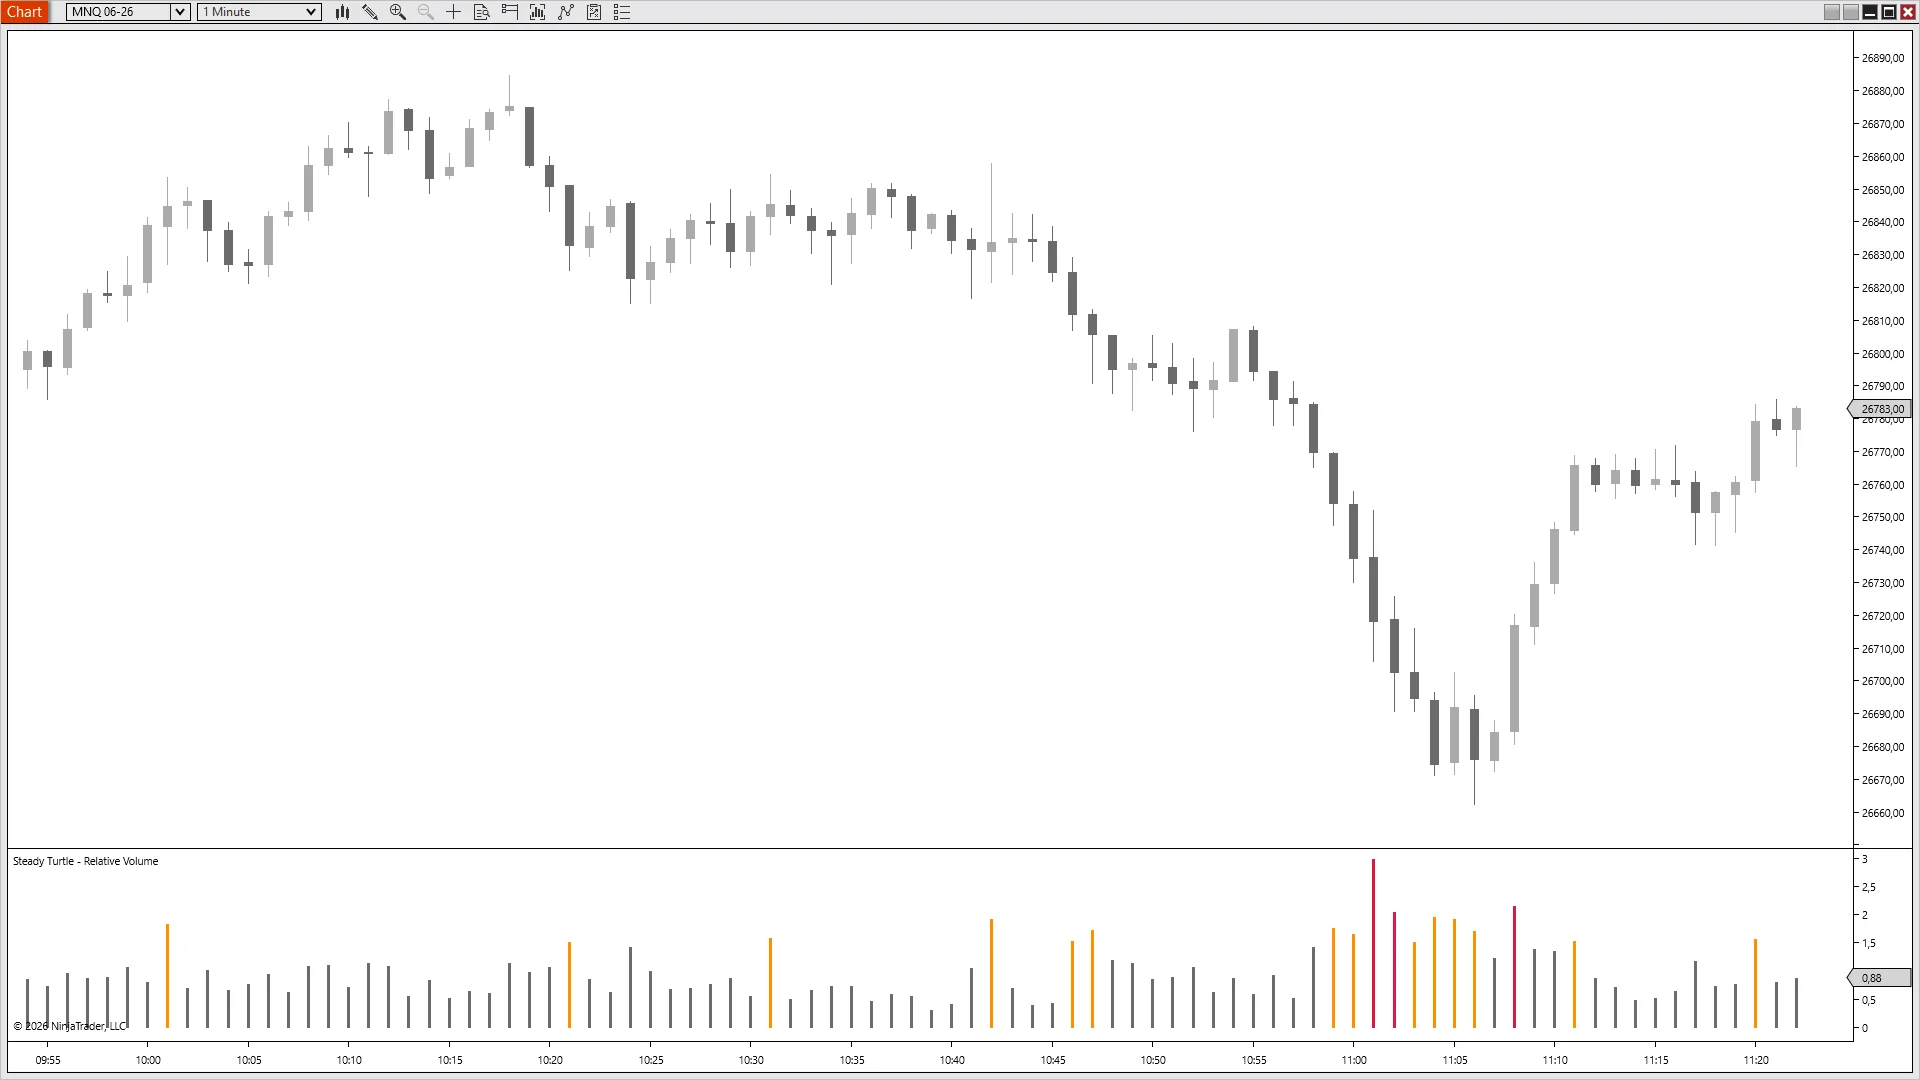
The signal fires first.
Price has been chopping for over an hour on grey, average volume. At 11:01 a 3× red bar prints, the candle is barely larger than the ones before it. Two bars later the floor drops out, and from there orange and red prints stack through the flush and the bounce. The volume signal preceded the price move by minutes: by the time the chart obviously broke, the indicator had already told you something changed.
Trend day, kept
printing red.
MNQ 06-26 · RTH · 1mNinjaTrader 8 · live session
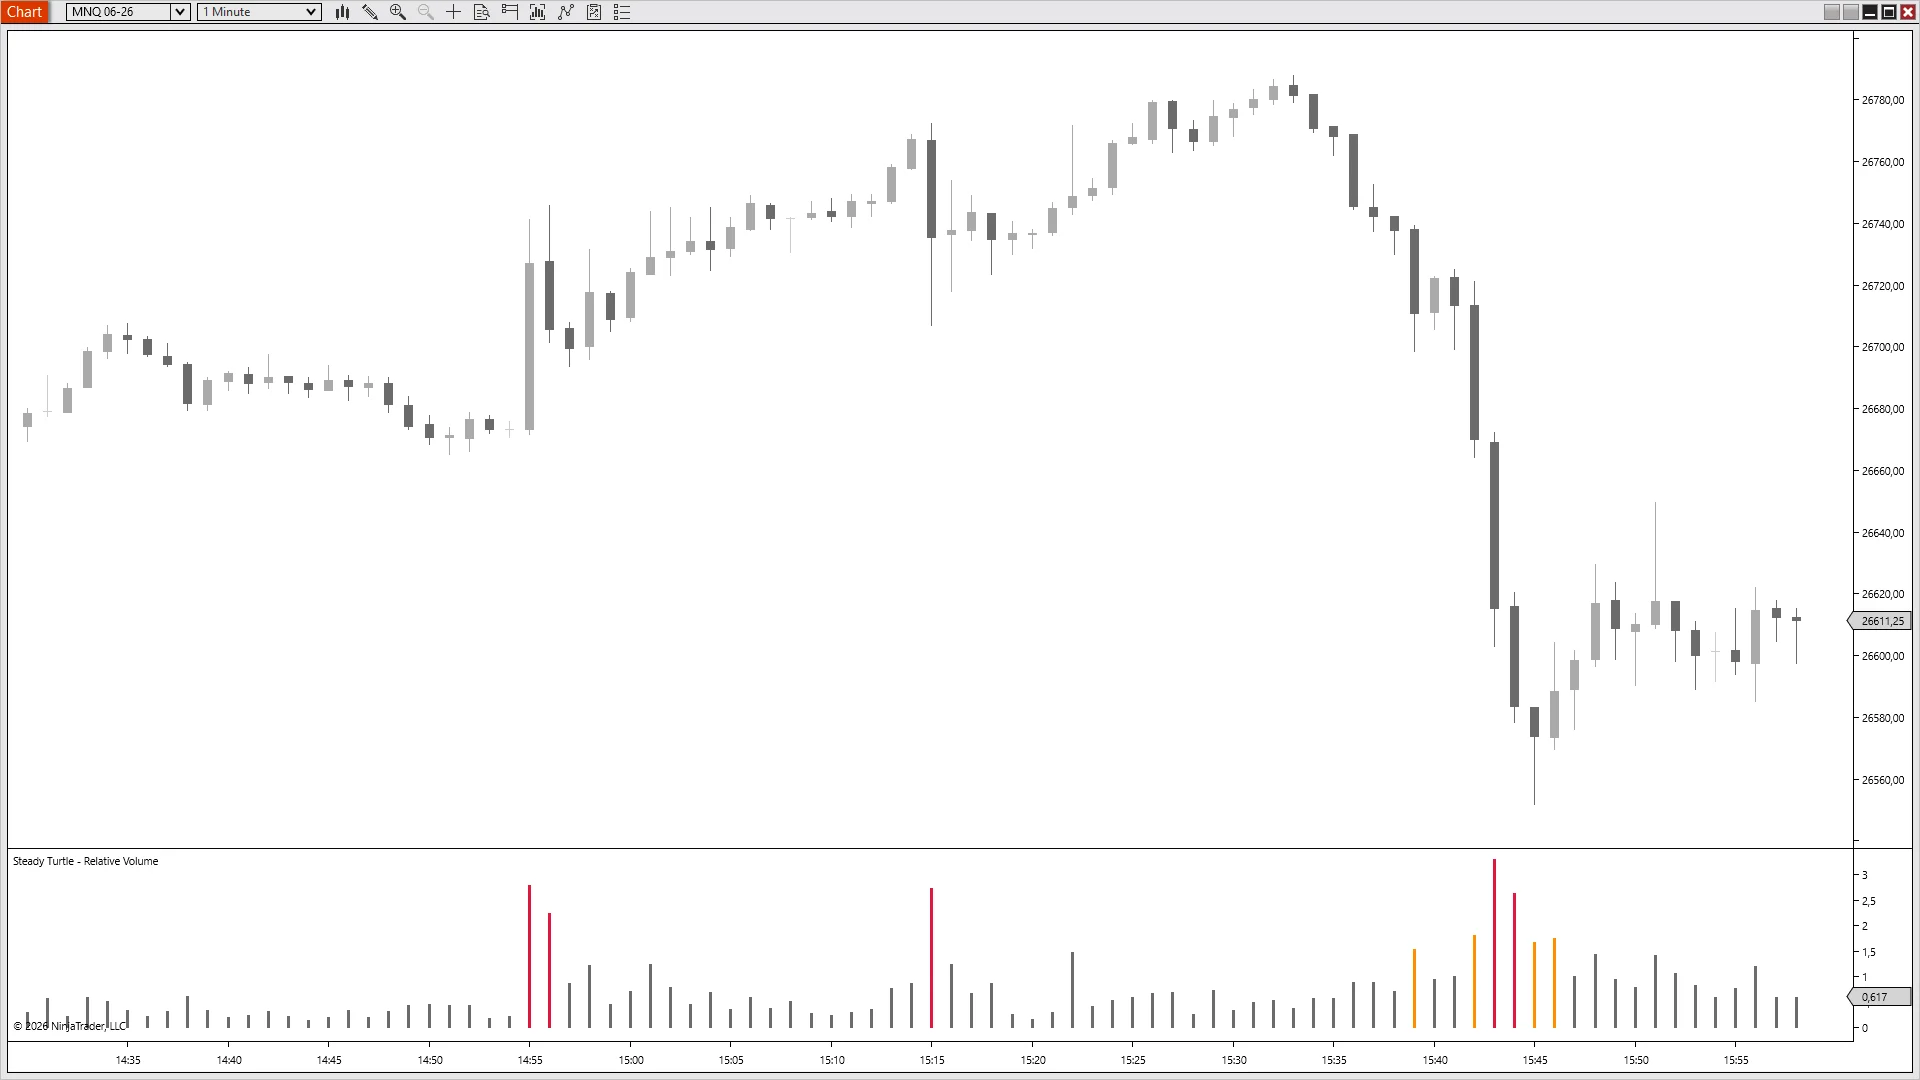
Sustained, not a probe.
A clean directional sell-off from 26780 to 26560, and the RVol panel doesn't print one spike, it prints a whole cluster. Red bars at 14:55, 15:15, 15:43, surrounded by orange. The conviction is right there in the histogram: every step down brings real volume with it. That's the difference between a thin-tape drift and a trend day worth chasing, the indicator separates them in one glance.
Capitulation,
then nothing.
MNQ 06-26 · RTH · 1mNinjaTrader 8 · live session
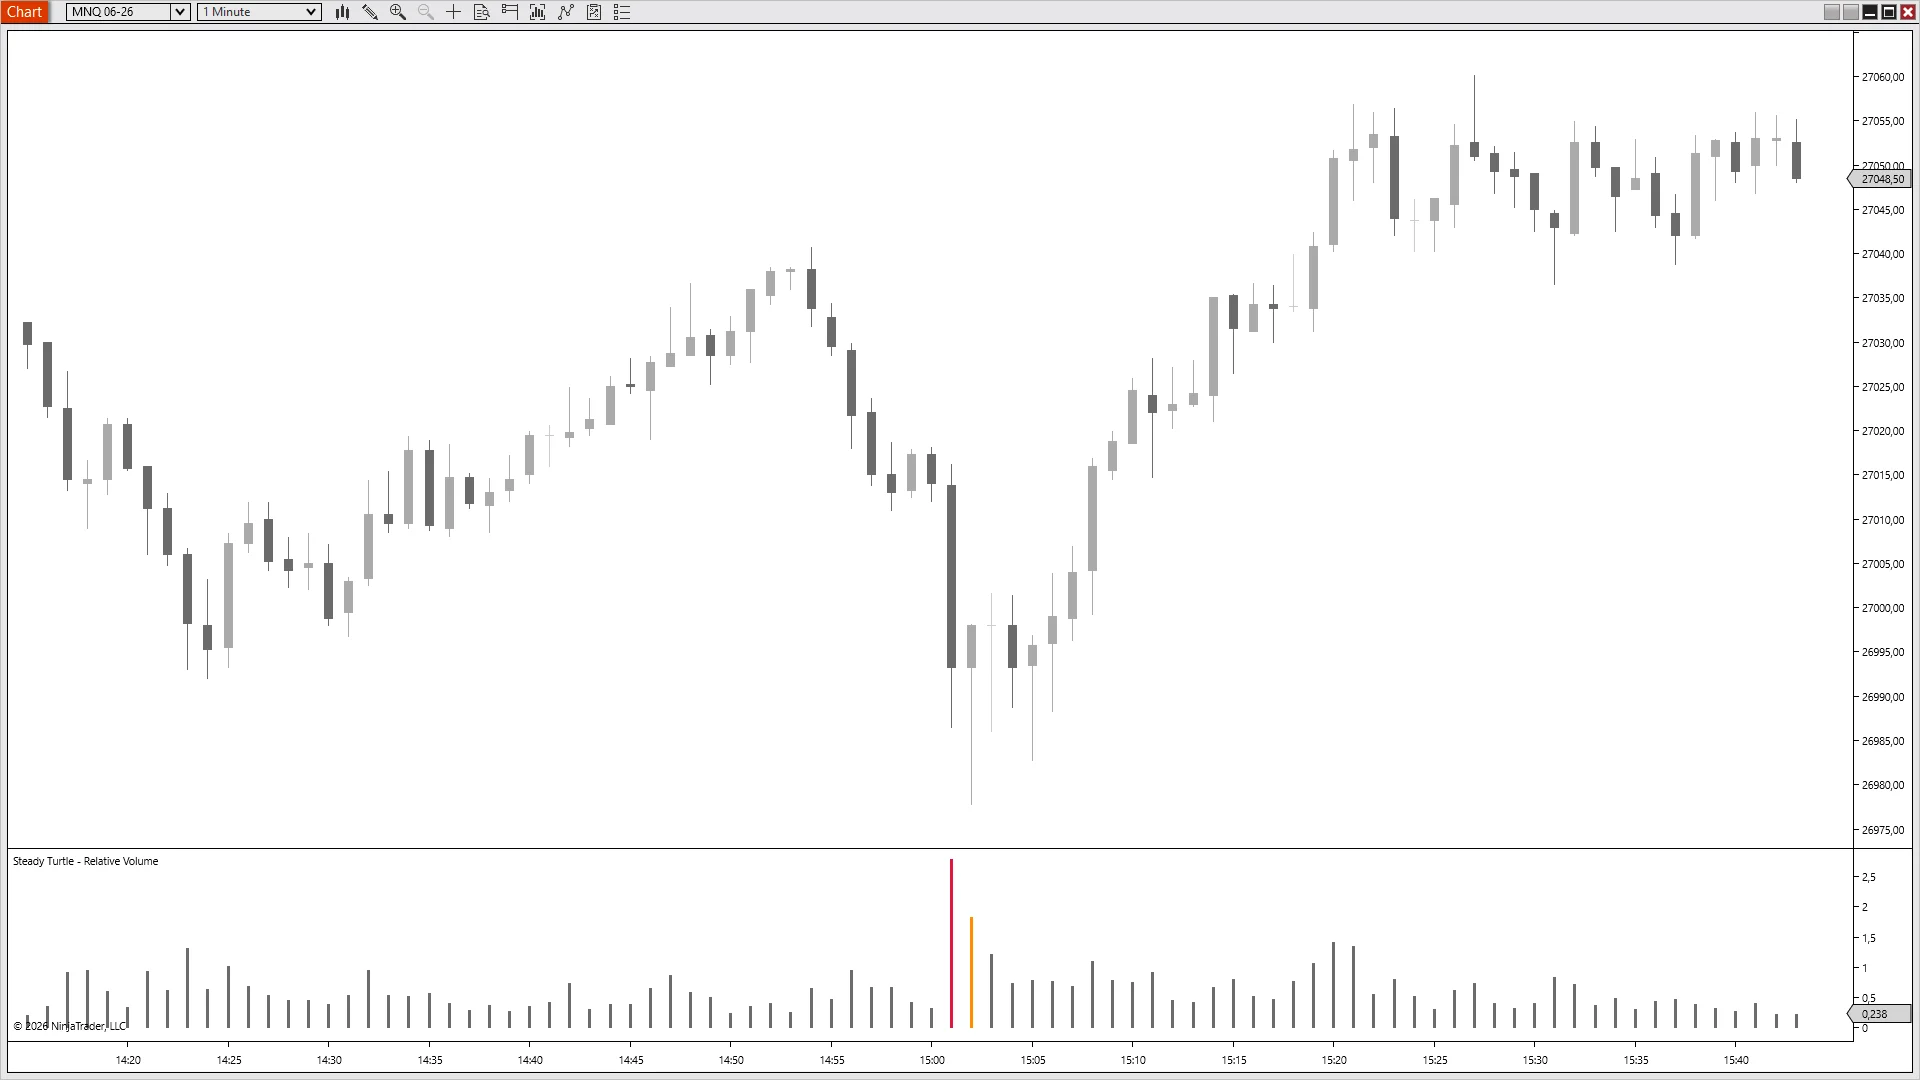
The recovery had no buyers.
The flush prints one 2.5× red bar at 15:01, the exact candle that marks the session low. From there price recovers thirty handles in twenty minutes. But look at the RVol panel: the rally happens on a sea of grey, with the final reading at 0.24×, barely a quarter of average. A red bar at the low told you sellers were done; an empty histogram on the rebound told you buyers never showed up. The level holds, but there's nothing under it.
What traders
actually
say.
Three quotes, three different reasons this one earned a slot in the workspace.
★★★★★
“RVol changed how I confirm breakouts. Used to get faked out constantly. Now I wait for the volume spike and my win rate got a lot better.”
Verified buyer
★★★★★
“The Volume Efficiency bonus tool is clutch. When you see high volume but price not moving much, that's where the absorption is happening, trade that.”
Verified buyer
★★★★★
“Gray means wait, gold means pay attention, red means go. Can't trade without it now, it's the one indicator I refuse to close.”
Verified buyer
PricingOne-time · No discounts · No expiry
One indicator. Or everything.
À la carte is $49. The bundle is $299 for everything, including every indicator I ship next year.
Everything traders ask me before they buy. If yours isn't here, email me →.
Standard volume plots absolute numbers, 20,000 contracts is 20,000 contracts, whether it's the first minute of RTH or lunch. This RVol builds a running average of every bar in the current session (starting 09:35 ET) and divides each new bar by that running average. A 2.0× print means twice the cumulative average flow of today's session so far. The baseline rebuilds every session, no lookback to prior days, no time-of-day comparison. Just today's bar against today's developing session.
The first five minutes of cash flood with overnight-order executions and opening-auction fills, volume spikes artificially, and any baseline that includes it gets distorted for the rest of the session. Starting the calculation at 09:35 skips that noise. Display waits until 09:40 so the running average has real session data behind it (at least five bars on a 1-minute chart), otherwise the first few ratios would be wild outliers against a sample of n=1 or n=2. Both start times are configurable if you want to shift the window.
Three thresholds, configurable: Gray below 1.5× (normal volume, skip), Gold between 1.5× and 2.0× (elevated, look), Red above 2.0× (high, act). When the Volume Efficiency filter is on, confirmed bars get a second color (blue for high, orange for elevated) so you can distinguish genuine flow from absorption at a glance.
Volume Efficiency measures how much volume is required to move price a given distance. High efficiency (lots of volume, small range) indicates absorption, someone is providing liquidity into the move. Low efficiency (normal volume, large range) suggests clean momentum. The bonus tool recolors bars when the efficiency threshold is crossed, making absorption vs. clean breakout readable without flipping between indicators.
Any instrument NT8 can chart with real volume data, ES, MES, NQ, MNQ, YM, RTY, CL, GC, and most major futures. Especially effective on the index futures where institutional participation is highest. Markets with thin or synthetic volume (some equities, spot FX) won't produce meaningful readings because the session average collapses to noise.
RVol works on any timeframe but is most effective on 1-5 minute intraday charts. A common setup: 5-minute for the overall structural read, 1-minute for precision entry timing when the signal fires. Higher timeframes (15m+) still work but the signal frequency drops since each bar aggregates more of the session.
Yes, every edition, Free NT8, NT8 Lifetime License, and every tier in between. The only requirement is NinjaTrader 8 version 8.1.7 or newer. The indicator authenticates through NinjaTrader's email-based licensing, which needs a current build; older versions can't authenticate. Update via NT8's Control Center → Help → Check for Updates first if you're on an earlier version.
Yes, anywhere you sign in to NinjaTrader 8 with your user email. The license is tied to your NT8 user, not the machine, so desktop, laptop, and VPS all work the same. One user, unlimited machines.
Yes, lifetime updates. Every new version is free forever. If you buy the Complete Bundle, every future indicator I ship is also included at no extra cost.
Indicators are non-refundable, once you download, the software is yours to keep. Two ways to de-risk before buying: (a) try any of the free indicators first to confirm they load and run on your setup, and (b) email me with any pre-purchase questions at info@steady-turtle.com.
Every knob,
exposed.
Session boundaries you can shift, thresholds you can tune, and color pairs for every volume state. Here's what ships in the settings panel.
Name
Default
What it does
Session Start Time
09:35
When the session average calculation begins (ET). Default excludes the opening-auction volume spike.
Display Start Time
09:40
When colored bars begin printing (ET). Gives the running average five minutes to stabilize before readings are trusted.
Session End Time
16:00
When the session average stops updating (ET). Default ends at the RTH close.
High Threshold
2.0
Ratio above which bars color as "high" (default red). The threshold above which most traders act.
Elevated Threshold
1.5
Ratio above which bars color as "elevated" (default gold). Under the high threshold, the "look, don't act yet" zone.
Use Enhanced Calculation
False
Enables the Volume Efficiency filter. When on, bars that satisfy both the volume threshold AND the VE threshold get a second "confirmed" color.
VE Threshold
1.5
Volume Efficiency ratio required for a bar to count as VE-confirmed. Higher values demand more absorption before the confirmed color fires.
Minimum Range (Points)
5
Minimum bar range for the VE calculation. Filters out noise on tick-level bars where the ratio would be meaningless.
High Confirmed Color
CornflowerBlue
Bars above the high threshold that also pass the VE filter. Separates genuine breakouts from absorption.
High Color
Crimson
Bars above the high threshold without VE confirmation. Default red.
Elevated Confirmed Color
Orange
Bars in the elevated zone that also pass the VE filter.
Elevated Color
DarkGoldenrod
Bars in the elevated zone without VE confirmation. Default gold.
Normal Color
DimGray
Bars below the elevated threshold. Default gray.
Debug Mode
False
Print debug info to the NinjaScript output window.
While you're hereOften paired with Relative Volume
$49 buys the indicator. $299 buys everything, plus every one I ship next year. Either way, one payment, no subscription, and it runs wherever you log into NinjaTrader.
Futures and forex trading contains substantial risk and is not for every investor. An investor could potentially lose all or more than the initial investment. Risk capital is money that can be lost without jeopardizing ones' financial security or life style. Only risk capital should be used for trading and only those with sufficient risk capital should consider trading. Past performance is not necessarily indicative of future results.
Testimonials appearing on this website may not be representative of other clients or customers and is not a guarantee of future performance or success.
Hypothetical Performance Disclosure
Hypothetical performance results have many inherent limitations, some of which are described below. No representation is being made that any account will or is likely to achieve profits or losses similar to those shown; in fact, there are frequently sharp differences between hypothetical performance results and the actual results subsequently achieved by any particular trading program. One of the limitations of hypothetical performance results is that they are generally prepared with the benefit of hindsight. In addition, hypothetical trading does not involve financial risk, and no hypothetical trading record can completely account for the impact of financial risk of actual trading. For example, the ability to withstand losses or to adhere to a particular trading program in spite of trading losses are material points which can also adversely affect actual trading results. There are numerous other factors related to the markets in general or to the implementation of any specific trading program which cannot be fully accounted for in the preparation of hypothetical performance results and all which can adversely affect trading results.