Steady Turtle Steady Turtle Trading Futures · NinjaTrader 8 · Est. 2021
4.8/5 1,200+ futures traders
NinjaTrader 8 ES & NQ Futures ICT / SMC

Support becomes resistance
the instant it fails.

One-Time Purchase Lifetime Updates NinjaTrader 8

Every fair-value gap your chart leaves behind gets tracked in real time. The moment price closes through one in the opposite direction, the box recolors — bullish support flips to bearish resistance — so the retest is obvious before the next setup prints.

Or get all 12 in the Complete Bundle · $299 · see pricing →
MNQ 03-26
1m 5m 15m RTH
O 22130 · H 22172 · L 22118 · C 22168
SUPPORT RESISTANCE CLOSE-THROUGH · FLIP →
NinjaTrader 8 Workspace · Inverse FVG Loaded CME Globex · Live
§ 01 · The Mechanic The idea, in one page

A gap, a break, a flip.

A fair-value gap is a three-candle imbalance — a pocket of air left behind when price moved too fast for the market to fill. For a few bars it reads as support. But every gap has a shelf life. The moment a candle closes through it in the opposite direction, the role reverses — and that reversal is where the edge lives.

① GAP FORMS ② CLOSE-THROUGH ③ REJECTION ON RETEST FVG · SUPPORT iFVG · RESISTANCE FLIP →
§ 02 · On Real Charts Evidence, not marketing

The indicator, in the wild.

Three MNQ sessions — the lifecycle in one frame, then the same gap before and after it inverted.

MNQ 06-26 · RTH · 1m

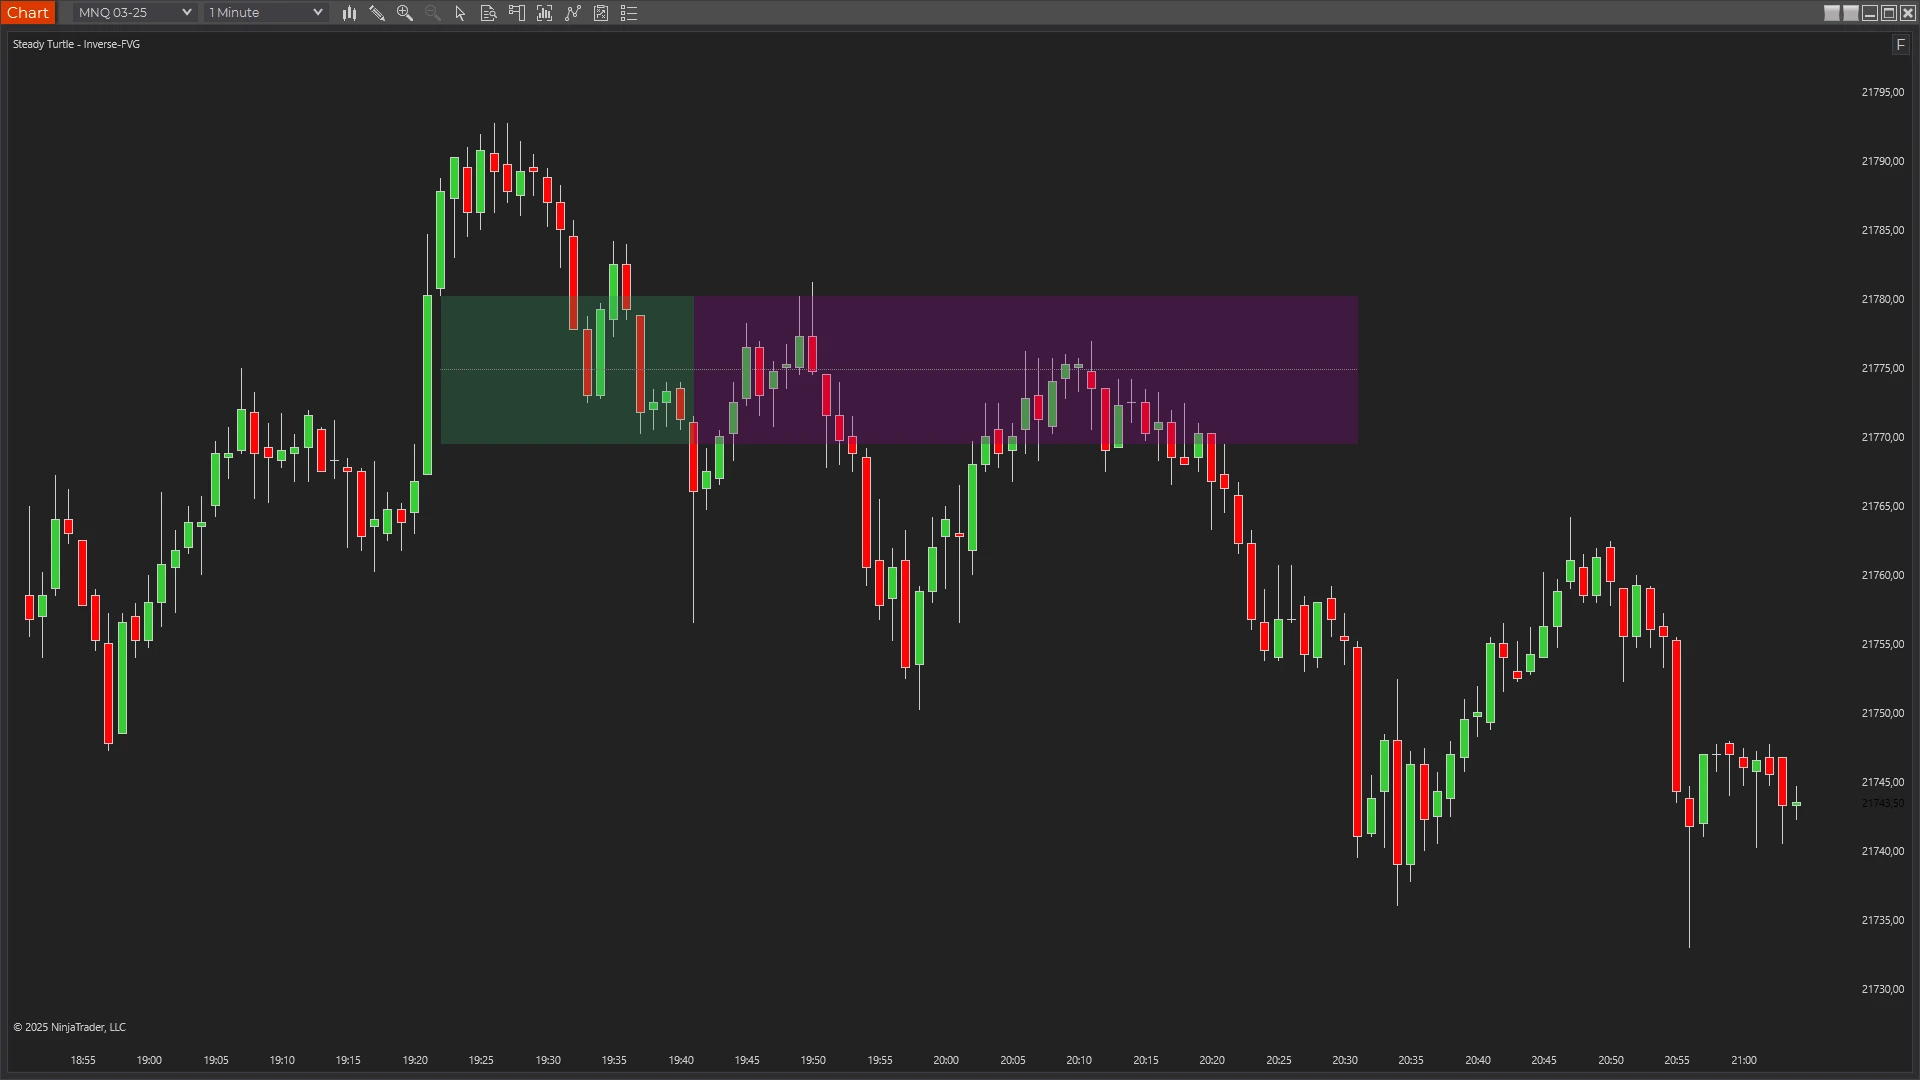
Lifecycle, one frame.

A bullish FVG on MNQ holding as support, breaking down, recoloring purple on the inversion candle, and getting rejected on the retest

Form, fail, flip, fade.

A bullish FVG forms at 25420–25425 on the 13:18–13:21 push. Price holds it as support through twenty-five minutes of chop — multiple tests, no closes through. Then the 13:45 candle closes down through the bottom and the box recolors from green to purple on that bar: the role flipped. Twenty minutes later, price rallies back up to retest the purple zone from below, wicks in, and rolls back over. Formation, break, inversion, and retest fade — the full arc visible on a single chart.

MNQ 06-26 · Globex · 1m

A bearish FVG, doing its job.

A bearish FVG on MNQ at 27425–27435 holding as resistance through four separate tests, never closing through

Four tests, four rejections.

A bearish FVG draws at 27425–27435 from the sharp 03:05 drop. Price spends the next ninety minutes coming back up to test it — 03:25, 03:55, 04:00, 04:02 — and gets rejected on every push. Wicks into the box, no closes above. The indicator marks the zone the moment it forms, then keeps it on the chart while it does what bearish FVGs do: cap rallies. Normal behavior, normal color, drawn for you in real time.

MNQ 06-26 · Globex · 1m

Same gap, inverted.

The same bearish FVG from the prior chart inverting on MNQ — the box recolors purple to green at 04:45 when price closes above it, and the level then acts as support during the rally

The candle that switched its job.

The same 27425–27435 zone from the prior chart, an hour later. After four failed tests, the 04:45 candle finally closes above the top — and the right half of the box recolors green on that exact bar. Role flipped from resistance to support. Price runs from 27435 to 27455 over the next thirty minutes without revisiting the now-green level. Same gap, opposite job, and the indicator marked the moment of the switch instead of leaving you to guess after the fact.

§ 03 · The Receipts What traders say

What traders actually say.

No curated five-star walls. Three quotes, three different reasons this one stays on the chart.

The inversion detection is what got me to buy. Knowing when an FVG fails and flips from support to resistance gives me entries I'd totally miss otherwise.
— Verified buyer
I run this with the Intraday Levels indicator. When an FVG lines up with yesterday's high or a pivot, that's my best setup by far.
— Verified buyer
Been running this for 3 months on NQ. Those inversed FVGs are basically my main reversal signal now.
— Verified buyer
§ 04 · Pricing One-time · No discounts · No expiry

One indicator. Or twelve.

The math writes itself. À la carte is $49. The bundle is $299 for everything — including every indicator I ship next year.

Inverse FVG

Buy this one indicator standalone.

$49
One-time
  • Any paid indicator à la carte
  • Lifetime updates for that tool
  • One user license (works on multiple machines)
  • Email support
  • Other indicators
  • Future releases
Editor's Pick

Complete Bundle

All 12 indicators, every future release, forever.

$299
One-time
  • All 12 current indicators
  • Every future indicator, free
  • Lifetime updates
  • One user license (works on multiple machines)
  • Priority support
  • One-time payment, no subscriptions

$24.92 per tool · vs $49 à la carte

One-Time Purchase Lifetime Updates NT8 8.1.6+
§ 05 · Questions Objection handler

A few things first.

Everything traders ask me before they buy. If yours isn't here, email me →.

The free Fair Value Gap indicator detects and tracks gaps. The Inverse FVG adds inversion detection — the moment price closes through a gap in the opposite direction, the box flips color to mark the role reversal (support → resistance, or vice versa). It also adds size filters, a high-probability filter, and a 50% midline.
Any instrument NT8 can chart — ES, NQ, MES, MNQ, CL, GC, 6E, equities, FX. Defaults are tuned for ES and NQ on 5-minute charts; the size-filter defaults (20–40 ticks) can be adjusted per instrument.
A bullish FVG that gets decisively broken (price closes through it to the downside) "inverts" — what was support now acts as resistance. The indicator watches for the close-through and recolors the box at that moment, so the flip is visible on the candle it happens.
Yes. Fair Value Gaps are a core ICT primitive, and the inversion logic aligns with ICT's concept of failed support/resistance ("iFVG"). The high-probability filter and 50% midline ("consequent encroachment") are standard SMC usage.
Yes, every edition — Free NT8, NT8 Lifetime License, and every tier in between. The only requirement is NinjaTrader 8 version 8.1.6 or newer — that's the build where NinjaTrader introduced email-based licensing, which the indicator uses to authenticate. Older builds can't authenticate; update via NT8's Control Center → Help → Check for Updates first if you're on an earlier version.
Yes — anywhere you sign in to NinjaTrader 8 with your user email. The license is tied to your NT8 user, not the machine, so desktop, laptop, and VPS all work the same. One user, unlimited machines.
Yes, lifetime updates. Every new version is free forever. If you buy the Complete Bundle, every future indicator I ship is also included at no extra cost.
Indicators are non-refundable — once you download, the software is yours to keep. Two ways to de-risk before buying: (a) try any of the free indicators first to confirm they load and run on your setup, and (b) email me with any pre-purchase questions at info@steady-turtle.com.
§ 06 · Settings Reference For the record

Every knob, exposed.

For the traders who need to know every knob before buying — here's what ships in the settings panel, and what it does.

Name Default What it does
Min FVG Size (Ticks) 20 Minimum gap size in ticks before the indicator draws it. Filters out micro-gaps.
Max FVG Size (Ticks) 40 Maximum gap size in ticks. Prevents oversized gaps from noisy bars.
Remove Invalidated Gaps True If off, invalidated gaps remain on the chart but stop extending.
Show Only High Probable Gaps False If on, only shows gaps where the middle candle body is larger than its neighbors — stronger momentum setups.
Use Candle 2 Inversion False If on, inversion triggers on close beyond middle-candle high/low (less strict than full close-through).
Max Lookback Bars 240 Only shows gaps created within the last N bars. Keeps the chart uncluttered.
Projection Bars 0 Extend active gaps this many bars into the future. 0 = stop at current bar.
Bull Color (Normal) SeaGreen Fill color for bullish FVGs before inversion.
Bull Color (Inversed) Purple Fill color for bullish FVGs after they invert (now resistance).
Bear Color (Normal) Purple Fill color for bearish FVGs before inversion.
Bear Color (Inversed) SeaGreen Fill color for bearish FVGs after they invert (now support).
Box Opacity 20 Transparency of FVG boxes, 1–100. Lower values keep price action readable through the zones.
Show Midline True Draws a line at the 50% level of each FVG — the consequent encroachment level.
Midline Color Gray Color of the 50% midline.
Midline Opacity 40 Transparency of the 50% midline, 1–100.
Use Custom Interval False Detect FVGs on a custom interval instead of the chart interval.
Bar Type Minute Bar type used when Use Custom Interval is enabled.
Bar Period 5 Bar period used when Use Custom Interval is enabled.

See the flip before it flips you.

$49 buys the indicator. $299 buys all twelve — plus every one I ship next year. Either way, one payment, no subscription, and it runs wherever you log into NinjaTrader.

4.8/5 1,200+ futures traders
ONE-TIME · LIFETIME UPDATES · NT8 8.1.6+
Risk Disclosure

Futures and forex trading contains substantial risk and is not for every investor. An investor could potentially lose all or more than the initial investment. Risk capital is money that can be lost without jeopardizing ones' financial security or life style. Only risk capital should be used for trading and only those with sufficient risk capital should consider trading. Past performance is not necessarily indicative of future results.

Testimonials appearing on this website may not be representative of other clients or customers and is not a guarantee of future performance or success.

Hypothetical Performance Disclosure

Hypothetical performance results have many inherent limitations, some of which are described below. No representation is being made that any account will or is likely to achieve profits or losses similar to those shown; in fact, there are frequently sharp differences between hypothetical performance results and the actual results subsequently achieved by any particular trading program. One of the limitations of hypothetical performance results is that they are generally prepared with the benefit of hindsight. In addition, hypothetical trading does not involve financial risk, and no hypothetical trading record can completely account for the impact of financial risk of actual trading. For example, the ability to withstand losses or to adhere to a particular trading program in spite of trading losses are material points which can also adversely affect actual trading results. There are numerous other factors related to the markets in general or to the implementation of any specific trading program which cannot be fully accounted for in the preparation of hypothetical performance results and all which can adversely affect trading results.