Total bar volume is the average of everything that happened — fifty 20-lots and one 1,500-lot get blended into the same gray histogram. Big Trades pulls every bid/ask print apart, runs an adaptive threshold over the last 14 bars (median × 1.5×, floored), and only flags the outliers. Buys (ask side) plot as blue bubbles. Sells (bid side) plot as orange-red. Bubble size scales with volume. Where size actually hit the tape is now legible at a glance.
!Requires the NinjaTrader OrderFlow+ add-on for volumetric (bid/ask) bar data. Details below →
Or get all 12 in the Complete Bundle · $299 · see pricing →
NQ 03-26
1m5m15mRTH
O 25722.00H 25774.00L 25712.00C 25772.00
● NinjaTrader 8 Workspace · Big Trades LoadedCME Globex · Live
§ 01 · The MechanicThe idea, in one page
The median,
times
a multiplier.
Every bar carries a bid/ask volumetric footprint — how many contracts traded at the ask and at the bid, level by level. Big Trades keeps a rolling record of the single largest per-level print in each of the last fourteen bars and takes the median. Multiply by 1.5× to get the adaptive threshold (floored at 50 so dead tape doesn't generate noise). Each new print is compared against that number live. Anything above it gets bubbled — ask-side in blue, bid-side in orange-red — at the exact price it occurred. The threshold recomputes every bar, so the signal automatically calms down during quiet sessions and tightens during volatile ones.
§ 02 · On Real ChartsEvidence, not marketing
The indicator, in the
wild.
Three live NQ sessions. Sellers piling into the lows and getting absorbed. Buyers piling into a ceiling and getting faded. And one print that marked a turn before the candle even closed.
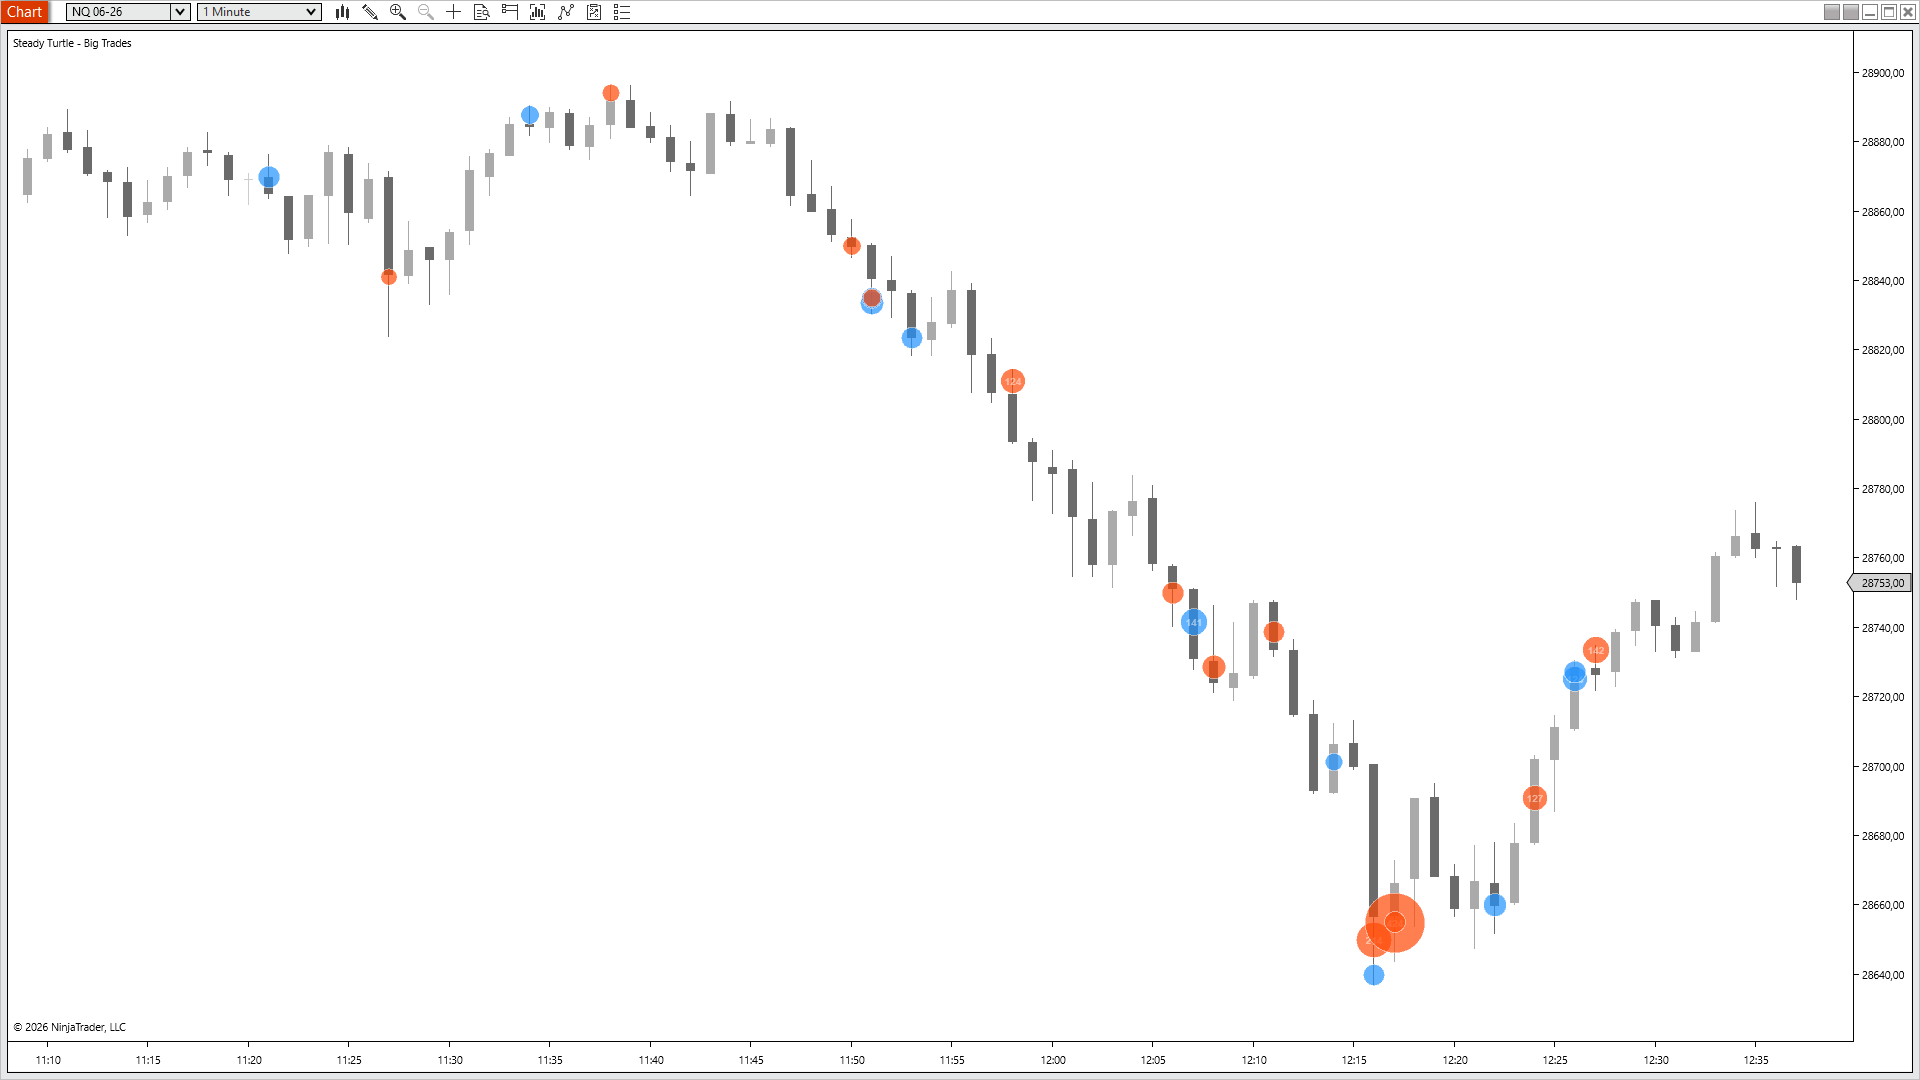
NQ 06-26 · 1m
The biggest sells
printed the bottom.
Sellers exhausted on the print.
Price unwinds 250 handles between 11:40 and 12:18 — clean trend down, every leg lower. Then at 12:15 a cluster of orange bubbles prints right at the lows around 28645, the largest sized over 2,000 contracts and stacked with three more nearby. Sellers were piling in. Price refused to go lower. Twenty minutes later we're back at 28760. The session's loudest sell prints didn't drive the next leg down — they marked the absorption bottom, while it was happening.
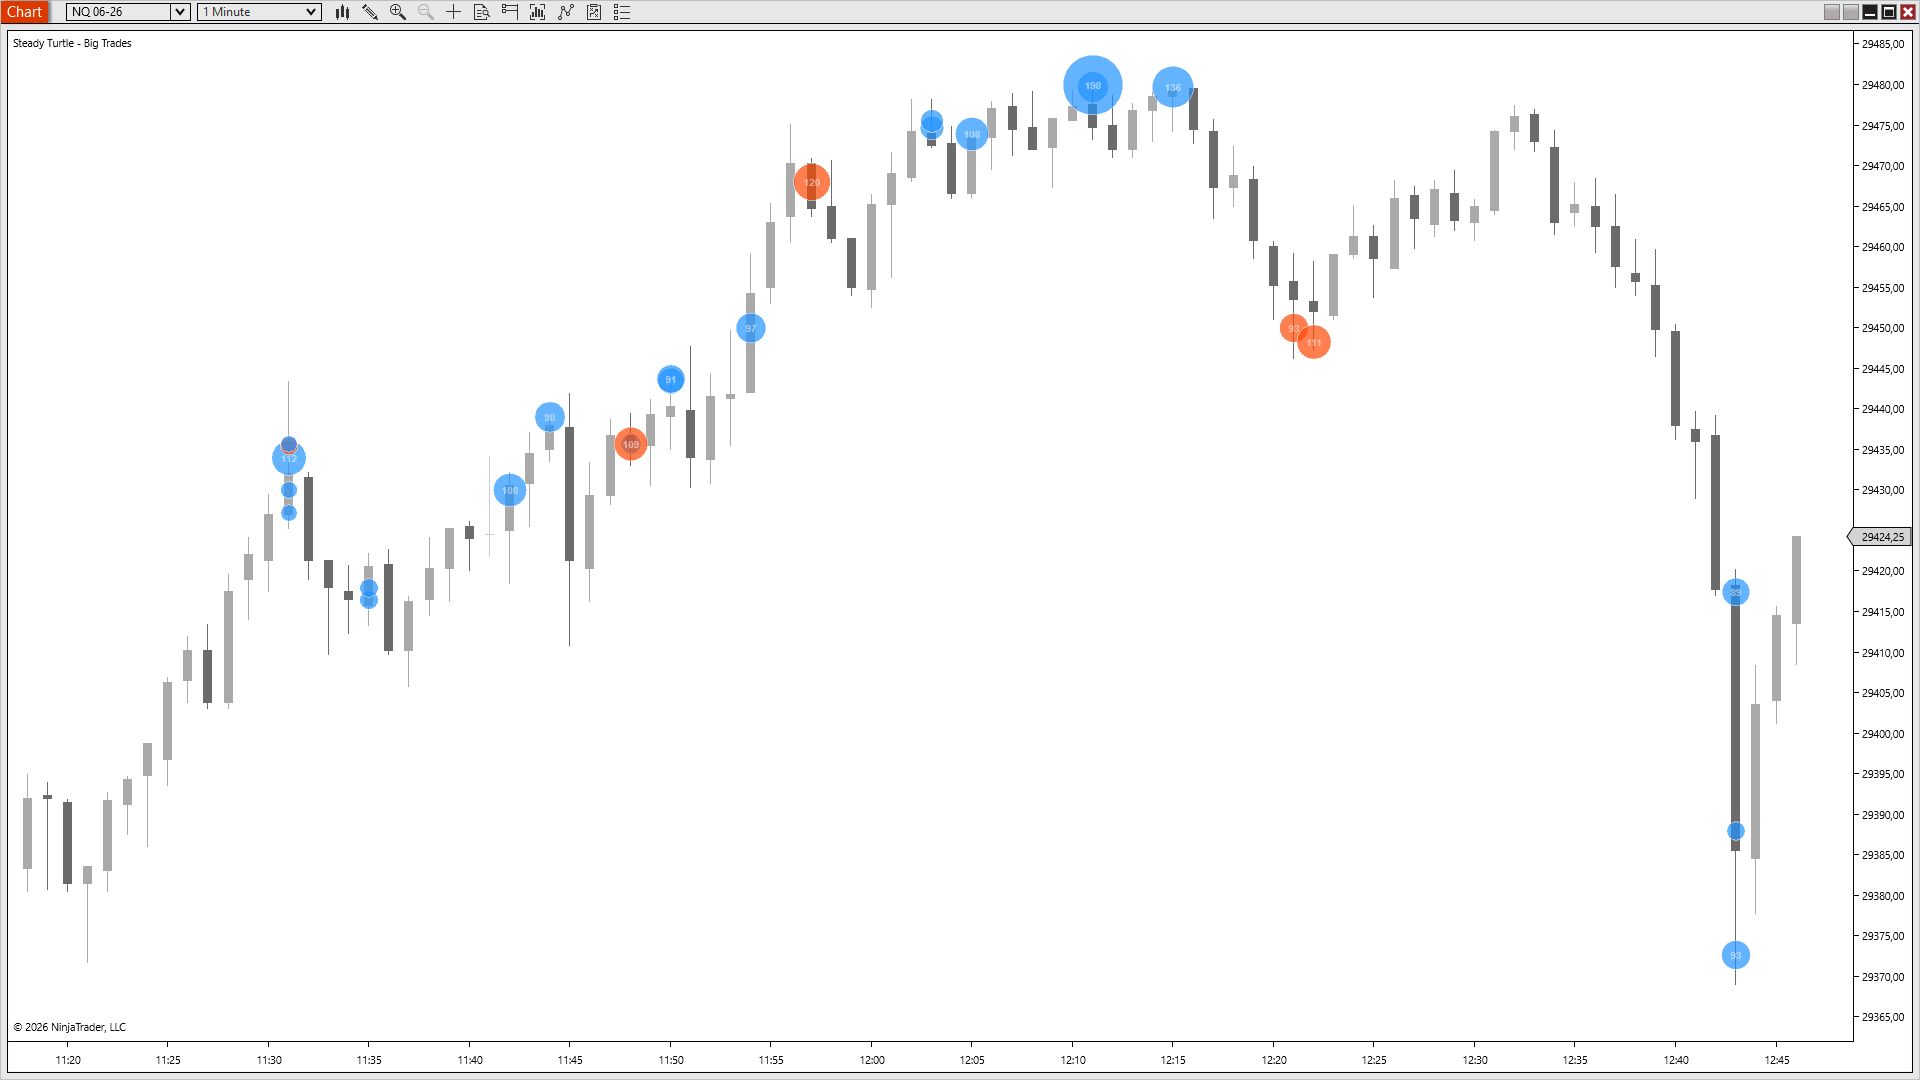
NQ 06-26 · 1m
Buyers showed up
and got faded.
Big buys, no breakout.
A clean rally lifts price from 29390 to 29485 over 45 minutes. At the top, two large blue prints fire — 198 and 136 contracts — at the exact resistance around 29480. Then nothing. Price tests the level a third time, prints a 128-contract orange bubble just below as sellers step in, and rolls. Inside thirty minutes we're back at 29385. Big buyers showed up at the ceiling and bought a chart that refused to follow — the absence of continuation, with the size already in, was the tell.
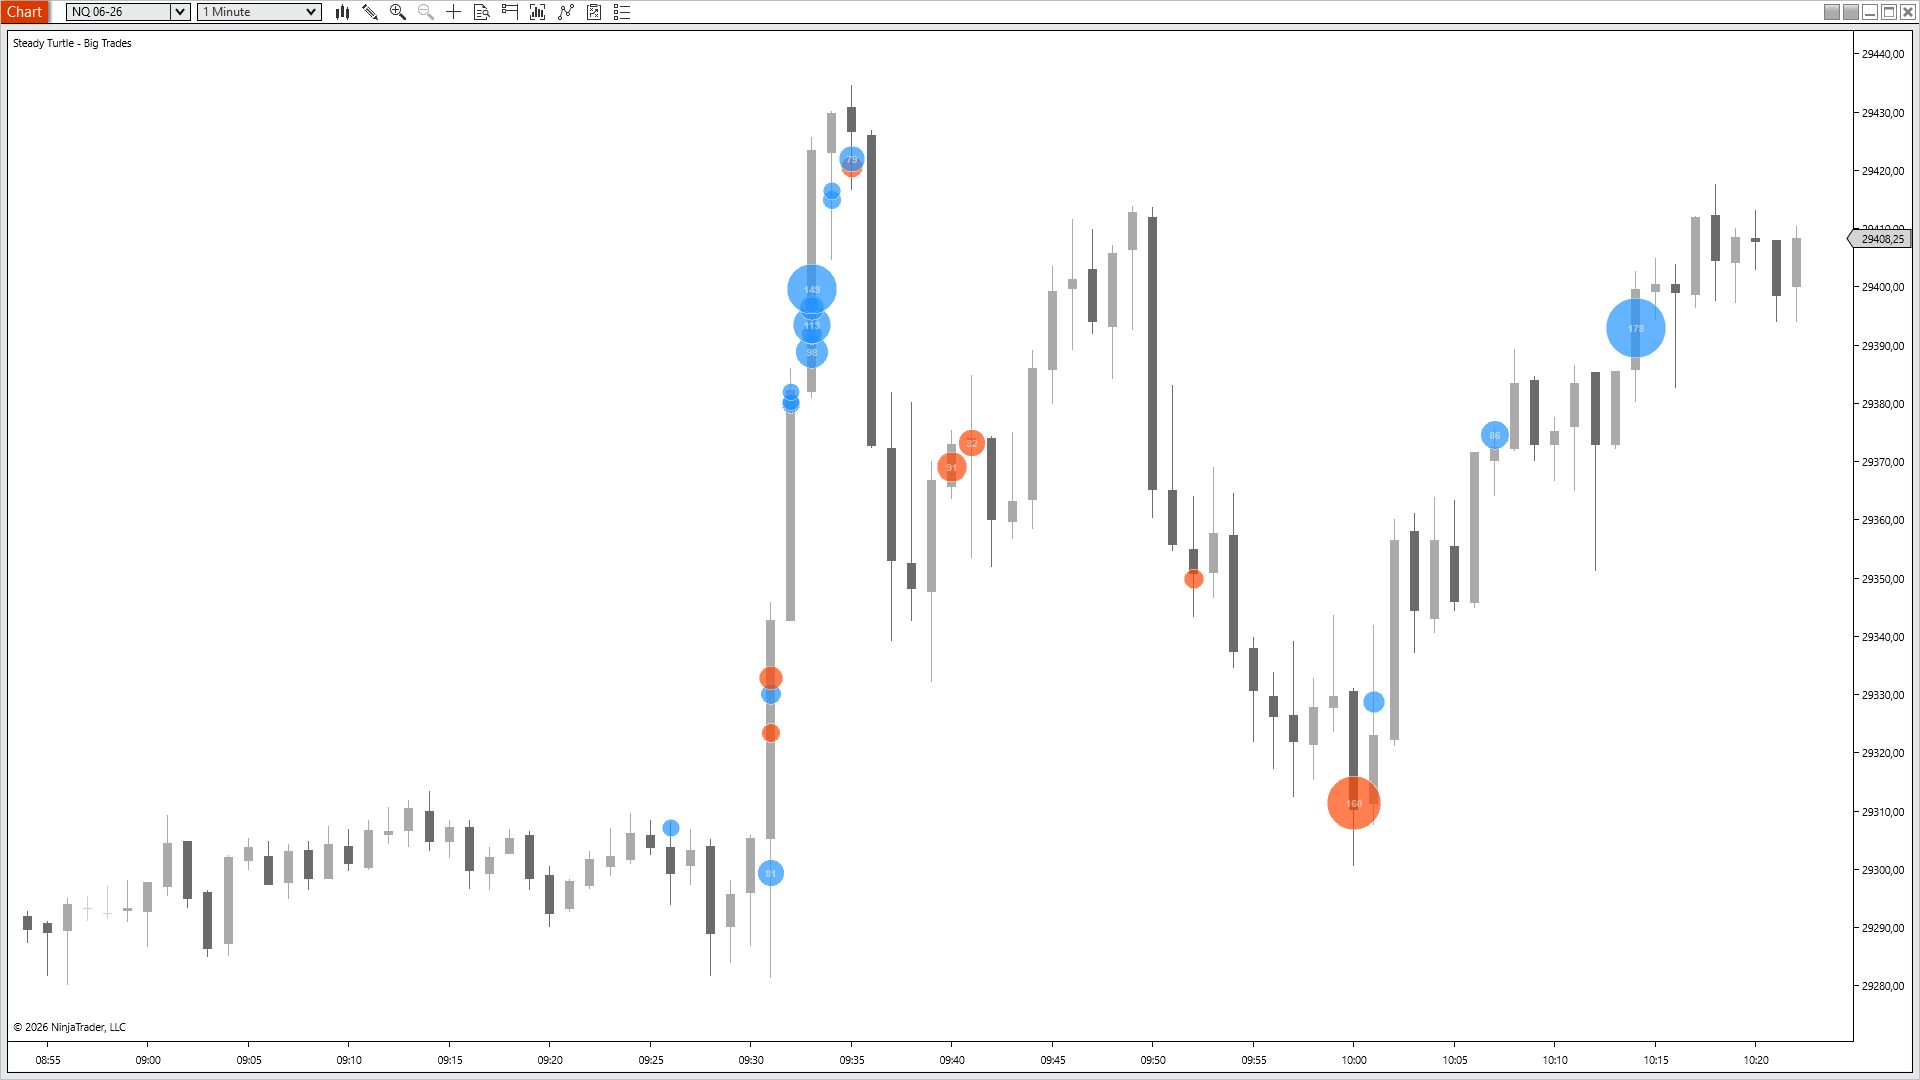
NQ 06-26 · 1m
One print,
one turn.
The bottom was the print.
After the 09:30 spike up to 29430, price gives it all back — drifting lower for the next 25 minutes into 29310 by 10:00. Right at the wick low, a single 160-contract orange bubble prints. That's the whole signal. The next candle reverses. Four bars later price is at 29380; fifteen later it's at 29410. One big seller showed up at the low, got absorbed, and the down move was done.
§ 03 · The ReceiptsWhat traders say
What traders
actually
say.
Three quotes, three reasons this one earned a slot in the workspace.
“
I stopped staring at the DOM. The bubbles tell me everything I used to scrape off the tape — and they stay on the chart so I can see where size hit twenty minutes ago, not just right now.
— Happy customer
“
Individual mode on a 1-minute is what makes this work. The number of bubbles tells you as much as the size — five sell prints stacked at the low is a different story from one big one.
— Happy customer
“
The adaptive threshold is the thing. I tried building this myself with a fixed number and gave up — the threshold needed to be different at 09:35 vs 14:00. Median × multiplier just works.
— Happy customer
§ 04 · PricingOne-time · No discounts · No expiry
One indicator. Or everything.
The math writes itself. À la carte is $49. The bundle is $299 for everything — including every indicator I ship next year.
Everything traders ask me before they buy. If yours isn't here, email me →.
Big is relative — that's the whole point. The indicator tracks the largest single bid- or ask-side print at each price level for each of the last fourteen bars (configurable), takes the median of those, and multiplies by 1.5×. Anything trading above that line gets flagged. So during a slow drift, 200 lots might qualify. During a news event, the bar moves to 1,500. A floor of 50 contracts is applied no matter what, so dead-tape periods don't generate false bubbles.
Because the price the big trade hit is half the information. A 1,500-lot buy at the bottom wick of a flush bar tells you something different from the same trade at the top of a green candle. A separate panel collapses every print to a vertical bar at the bar's x-coordinate — you lose the price coordinate entirely. Plotting bubbles directly on price means absorption, distribution, and aggressive entries are all readable in one glance, with their location preserved.
Individual shows every single big print separately — you might see five blue bubbles stacked at the lows of one bar. Best on 1-minute charts and below. Aggregated merges all buys for the bar into one bubble at the buy-VWAP, and all sells into one at the sell-VWAP, with bubble size proportional to total flagged volume. Best on 5-minute and above where individual prints stack into illegible clusters. Switch modes from the parameter panel without reloading.
Yes — OrderFlow+ is required to use the indicator the way it's meant to be used. The default VolumeAtPrice detection mode reads bid/ask volume from NinjaTrader's Volumetric bars, and Volumetric bars are an OrderFlow+ feature in NT8. Without OrderFlow+ enabled on your license, that mode can't load and a red error message will appear on the chart. You can check whether you have it under Help → About in NinjaTrader, or by trying to add a "Volumetric" bar type to a chart. If your chart uses Renko, Point & Figure, Line Break, or Kagi bars, the indicator automatically falls back to time-based volumetric series for the data source — but those series still need OrderFlow+ to populate.
There is a secondary SinglePrint detection mode that runs on raw tick data and works without OrderFlow+, but it only catches individual large trades — it can't see size accumulating at a price level the way VolumeAtPrice can. Treat it as a limited fallback, not a replacement. To get full value out of Big Trades, you need OrderFlow+.
Any instrument with real bid/ask volumetric data — ES, MES, NQ, MNQ, YM, RTY, CL, GC, and most major futures. The volumetric series the indicator reads from is time-based and added internally, which means it also works on Renko, Point & Figure, Line Break, and Kagi charts — not just minute and tick bars.
Every input is exposed. Lookback Bars sets how reactive the threshold is (3–200). Volume Multiplier sets how strict the cutoff is (1.0× catches more; 3.0× catches only the loudest). Min Volume Floor prevents false signals when the median collapses. Most traders leave the defaults — they were chosen against three months of NQ tape — but the knobs are there if your instrument needs them.
Yes, every edition — Free NT8, NT8 Lifetime License, and every tier in between. The only requirement is NinjaTrader 8 version 8.1.6 or newer — that's the build where NinjaTrader introduced email-based licensing, which the indicator uses to authenticate. Older builds can't authenticate; update via NT8's Control Center → Help → Check for Updates first if you're on an earlier version.
Yes — anywhere you sign in to NinjaTrader 8 with your user email. The license is tied to your NT8 user, not the machine, so desktop, laptop, and VPS all work the same. One user, unlimited machines.
Yes, lifetime updates. Every new version is free forever. If you buy the Complete Bundle, every future indicator I ship is also included at no extra cost.
Indicators are non-refundable — once you download, the software is yours to keep. Two ways to de-risk before buying: (a) try any of the free indicators first to confirm they load and run on your setup, and (b) email me with any pre-purchase questions at info@steady-turtle.com.
§ 06 · Settings ReferenceFor the record
Every knob,
exposed.
Two display modes, an adaptive threshold you can tune, bubble sizing, and full color control. Here's what ships in the settings panel.
Name
Default
What it does
Detection Mode
VolumeAtPrice
"VolumeAtPrice" flags heavy bid/ask volume that accumulates at a single price level within a sub-bar — requires the NinjaTrader OrderFlow+ add-on. "SinglePrint" flags individual large trades straight from the tick stream — works on any NinjaTrader account, but historical markers need Tick Replay enabled.
Display Mode
Individual
"Individual" plots every big print separately at its exact price. "Aggregated" merges all buys and all sells for the bar into one VWAP bubble each — cleaner on busy charts.
Lookback Bars
14
How many recent bars feed the median used to compute the adaptive threshold. Shorter = more reactive; longer = more stable.
Volume Multiplier
1.5
The median of recent max volumes is multiplied by this number to set the trigger. 1.5× catches meaningful outliers; raise it to 2.0× or higher for only the loudest prints.
Min Volume Floor
50
Absolute floor below which nothing gets flagged, even if the adaptive threshold would allow it. Stops dead-tape periods from generating false signals.
Bubble Opacity %
70
How transparent the bubbles render (5–100%). Lower keeps the candles legible underneath.
Buy Color
DodgerBlue
Color used for big ASK (buy-initiated) prints.
Sell Color
OrangeRed
Color used for big BID (sell-initiated) prints.
Min Bubble Size
8
Smallest bubble radius in pixels — used when a print is just barely over the threshold.
Max Bubble Size
30
Largest bubble radius in pixels — used by the loudest print in the visible window.
Show Volume Text
True
Print the volume number inside bubbles big enough to read it (radius ≥ 12px). Formats thousands as "1.2k".
Text Color
LightGray
Color of the volume number rendered inside each bubble.
Text Opacity %
100
Opacity of the volume number text (5–100%).
Outline Color
White @ 47%
Color of the thin ring drawn around each bubble. Default is a soft semi-transparent white that reads cleanly on both dark and light chart backgrounds.
Debug Mode
False
Print diagnostic info to the NinjaScript output window.
$49 buys the indicator. $299 buys everything — plus every one I ship next year. Either way, one payment, no subscription, and it runs wherever you log into NinjaTrader.
Futures and forex trading contains substantial risk and is not for every investor. An investor could potentially lose all or more than the initial investment. Risk capital is money that can be lost without jeopardizing ones' financial security or life style. Only risk capital should be used for trading and only those with sufficient risk capital should consider trading. Past performance is not necessarily indicative of future results.
Testimonials appearing on this website may not be representative of other clients or customers and is not a guarantee of future performance or success.
Hypothetical Performance Disclosure
Hypothetical performance results have many inherent limitations, some of which are described below. No representation is being made that any account will or is likely to achieve profits or losses similar to those shown; in fact, there are frequently sharp differences between hypothetical performance results and the actual results subsequently achieved by any particular trading program. One of the limitations of hypothetical performance results is that they are generally prepared with the benefit of hindsight. In addition, hypothetical trading does not involve financial risk, and no hypothetical trading record can completely account for the impact of financial risk of actual trading. For example, the ability to withstand losses or to adhere to a particular trading program in spite of trading losses are material points which can also adversely affect actual trading results. There are numerous other factors related to the markets in general or to the implementation of any specific trading program which cannot be fully accounted for in the preparation of hypothetical performance results and all which can adversely affect trading results.