Asia and London drew the high and low hours before the US open. This indicator marks those levels live, extends them through the RTH session, and drops optional midpoints, so the overnight range is already on your chart when you sit down.
Every night, Asia trades its eight-hour window. Three hours before you wake, London opens and puts the next range on top. By the time the US session rings in, four horizontal levels are already defined, the two session highs and the two session lows. The indicator draws them live, extends them through RTH, and optionally marks the 50% of each range. Everything else is noise around those lines.
The indicator, in the
wild.
Three MNQ sessions, the moment overnight levels activate, how their structure works, and how long they keep paying.
London takes
over.
MNQ 06-26 · Globex · 5mNinjaTrader 8 · live session
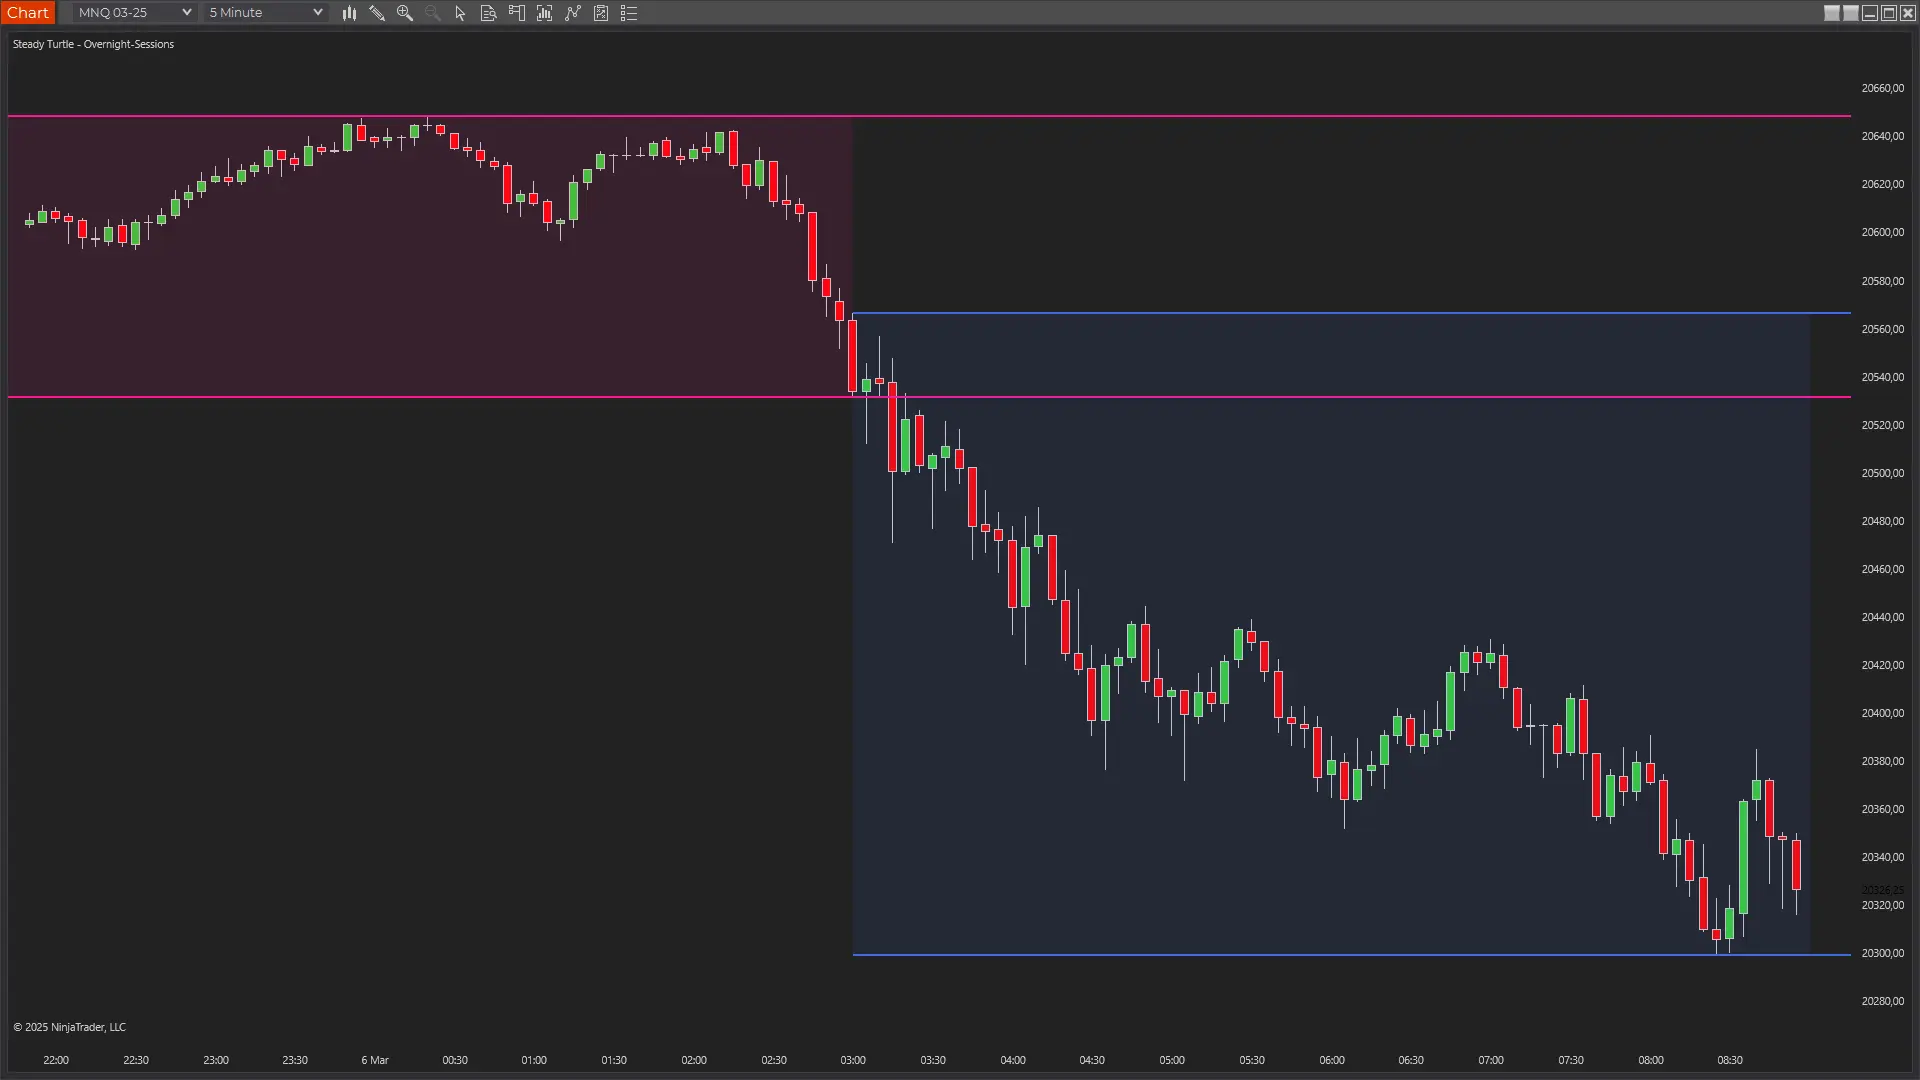
The overnight handoff is the trade.
Asia spends six hours coiling between 25570 and 25600, every push above Asia Mid (25590) gets sold, every dip back to it gets bought. At 03:00 the London box opens, and the very first candle clears the Asia High at 25620 and gaps to 25610. From there: one direction. London Low locks at 25578, price walks straight up to London High at 25655 in ninety minutes without a meaningful pullback. The Asia layer stops mattering the moment London prints its first range.
London Mid,
as the floor.
MNQ 06-26 · Globex · 5mNinjaTrader 8 · live session
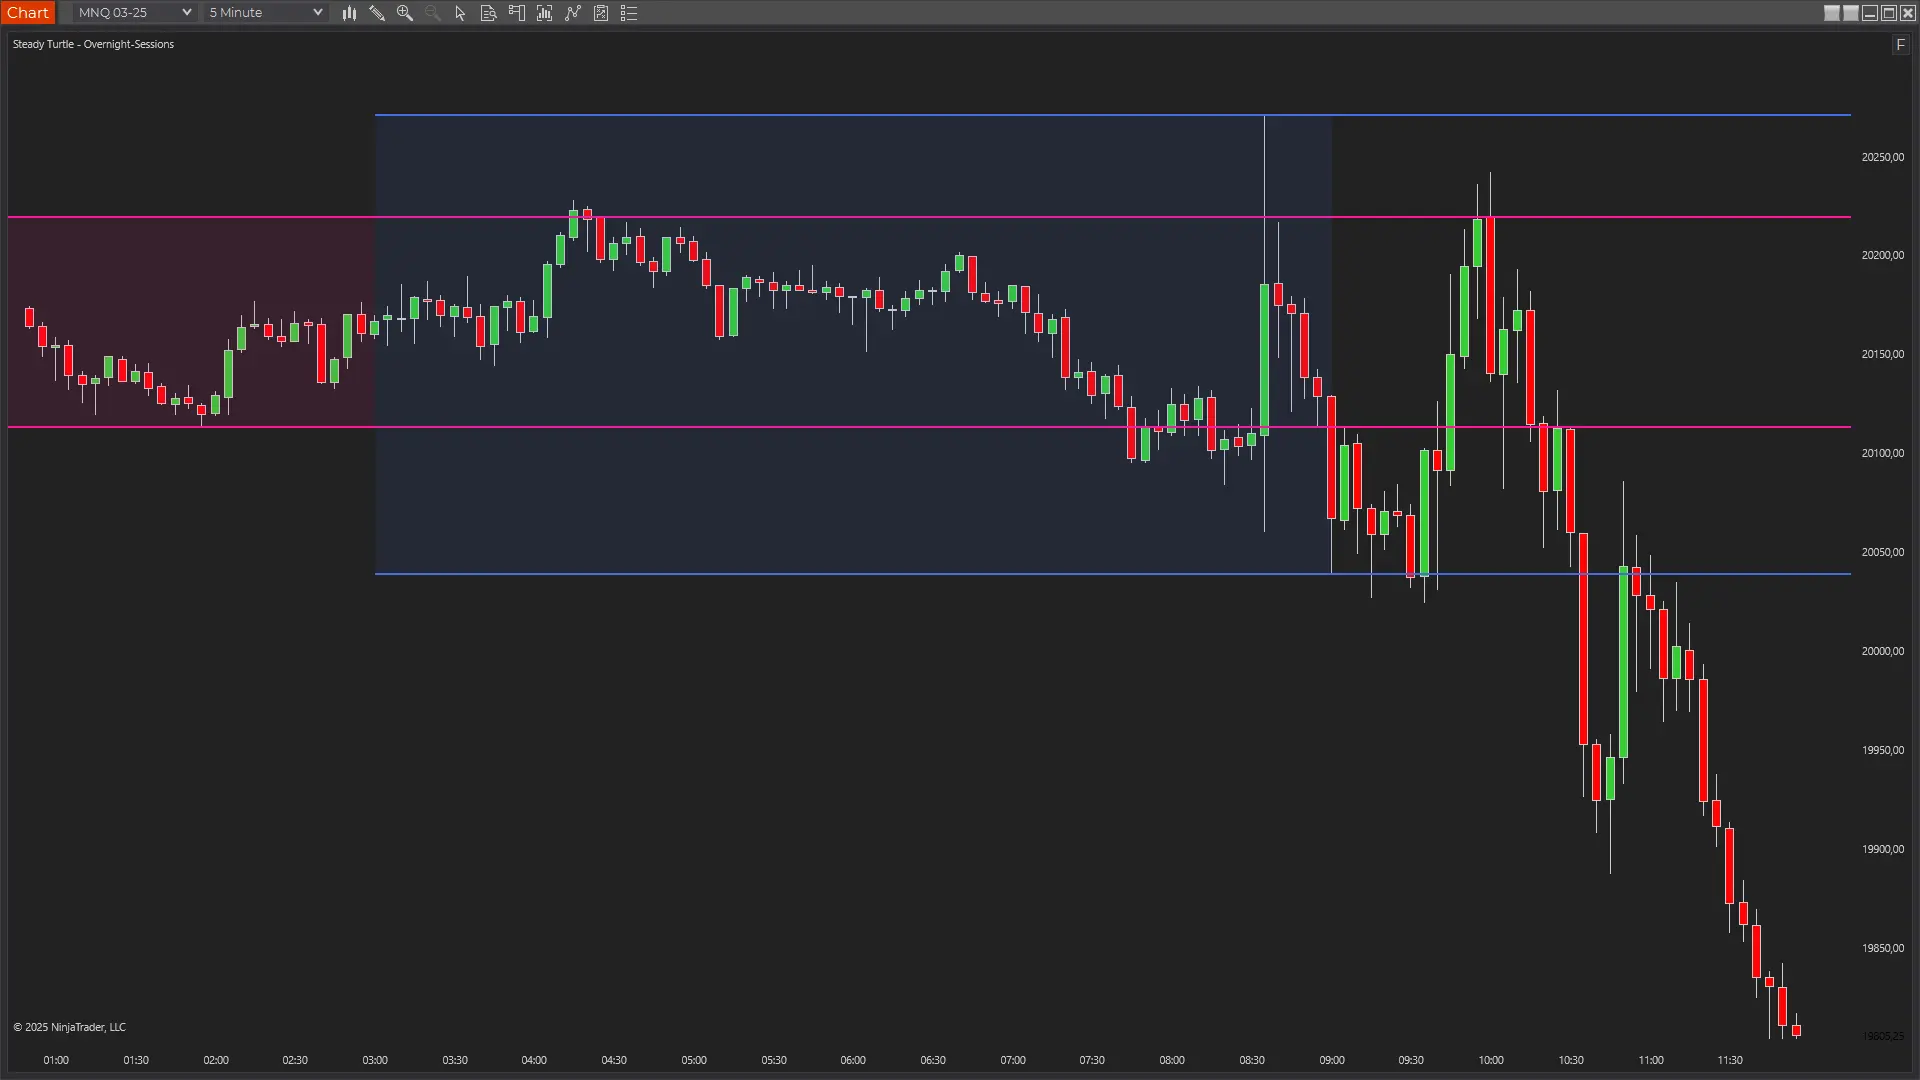
The line you couldn't draw by hand.
London opens with a gap-and-go that prints London High at 25697 by 05:15. Then the structure shows up. The first pullback, 06:00, bottoms one tick above London Mid at 25635, holds for four bars, rallies. The second pullback, 07:00, does the same: tags the line, holds, rallies. By 08:30 price is back at the London High making fresh ground. The midpoint isn't drawn until London closes, but on the next day the trade is right there: defended twice, broken zero times.
London High,
all day long.
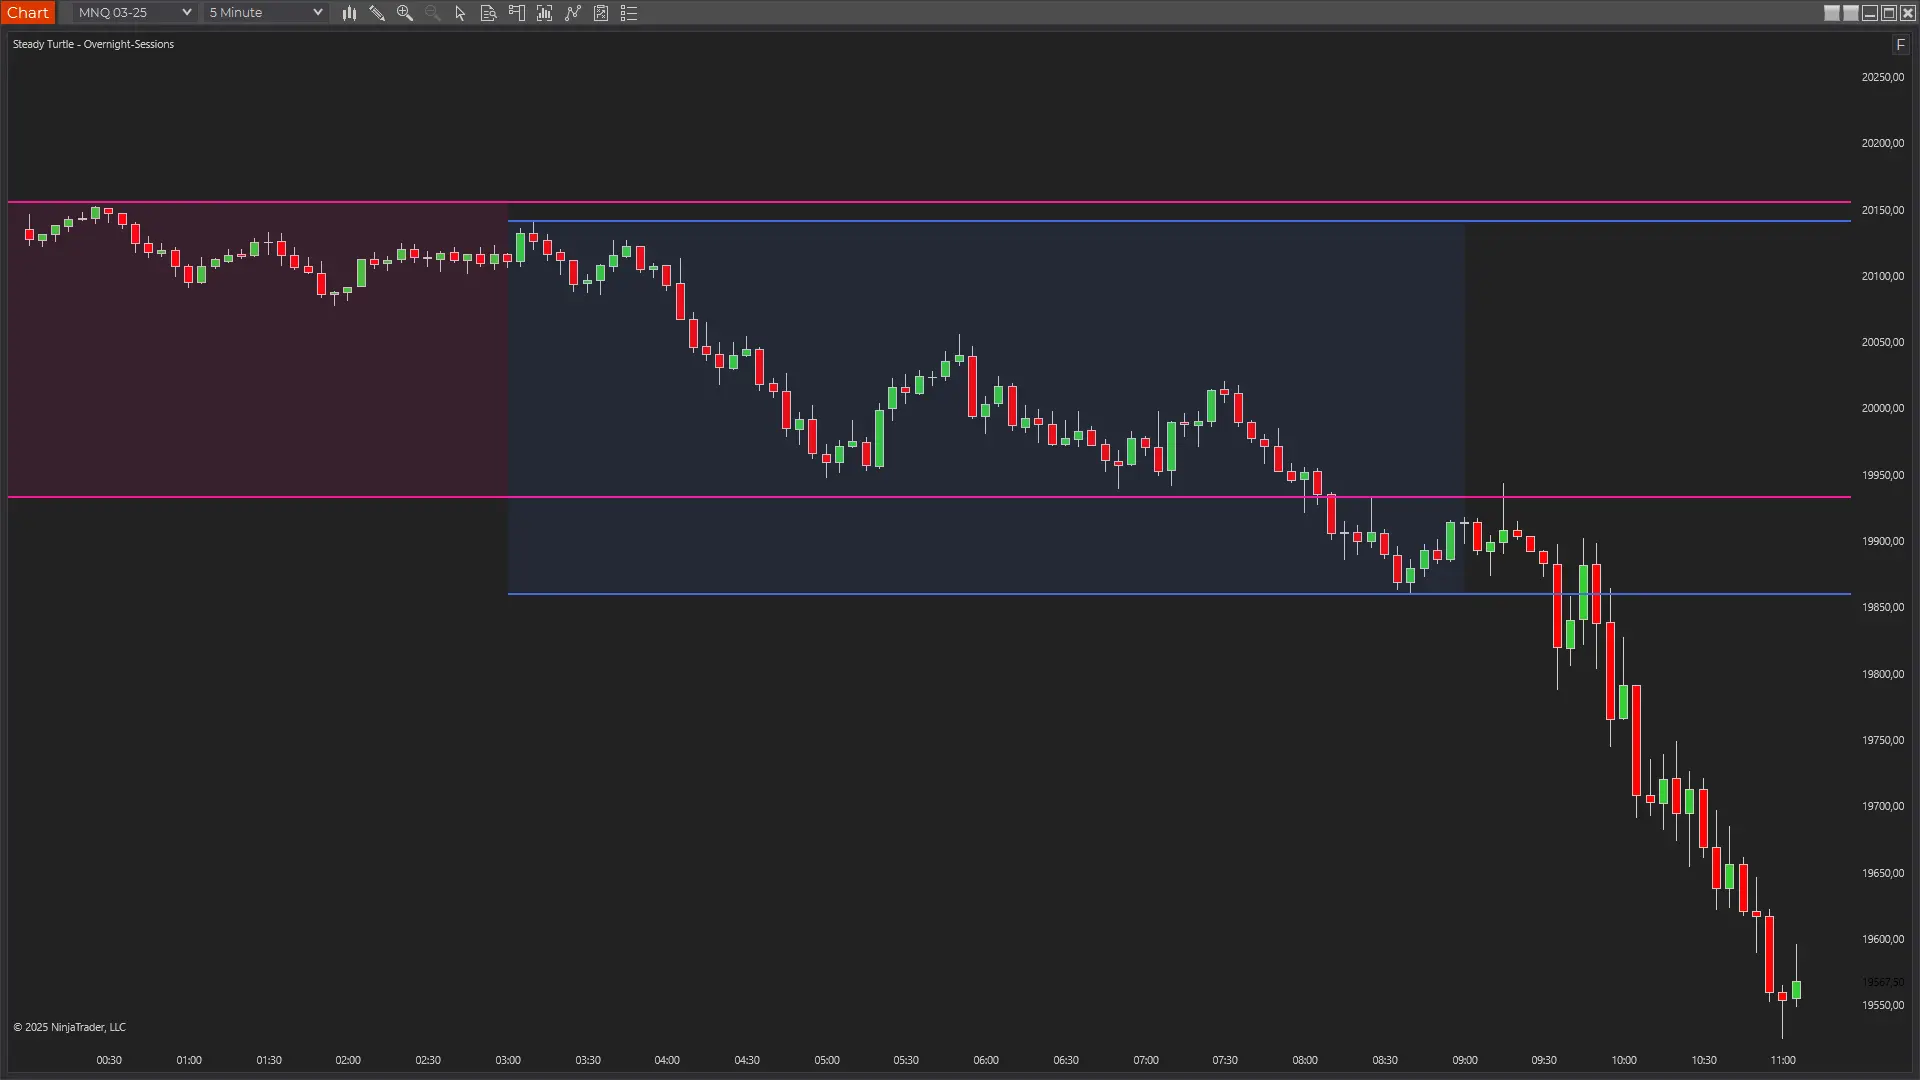
MNQ 06-26 · RTH · 5mNinjaTrader 8 · live session
One level, two roles, six hours apart.
NY opens with price drifting along London Mid (26600) at 08:30. Price clears it, runs straight into London High at 26750 by 09:00, and rejects, first test fails, second at 11:30 fails, third at 12:00 fails. Three rejections, no close above. Then at 13:30 the flush comes: price drops thirty points, retests London High *from above*, and finds bids on the same tick that rejected it all morning. Resistance becomes support. One overnight level priced in by London hours earlier framed every meaningful turn of the RTH session.
What traders
actually
say.
Three quotes, three different reasons this one earned a slot in the workspace.
★★★★★
“This totally changed how I look at overnight action. Used to always wonder why price was bouncing off random levels, turns out Asia or London set them up hours ago.”
Verified buyer
★★★★★
“London highs and lows are basically my whole game plan now. When NY opens and tests those levels I'm already ready with a setup instead of scrambling.”
Verified buyer
★★★★★
“I run this with the Initial Balance indicator, overnight levels plus the opening five minutes gives me everything I need to frame the day.”
Verified buyer
PricingOne-time · No discounts · No expiry
One indicator. Or everything.
À la carte is $49. The bundle is $299 for everything, including every indicator I ship next year.
Everything traders ask me before they buy. If yours isn't here, email me →.
Futures trade nearly 24 hours. While you sleep, Asia and Europe are establishing positions, support, and resistance, and those levels don't disappear when the US session opens. A London high that formed at 06:30 ET is the same price at 10:00 ET; it just has a new audience. First-touch rejections at overnight levels are one of the most reliable RTH setups you can run.
Asia: 19:00-03:00 ET. London: 03:00-09:00 ET. Optional NY AM: 08:00-12:00 ET. These match when the major financial centers in each region are actually moving volume. All times are specified in ET and convert automatically to your NinjaTrader timezone.
Yes. The indicator ships with three session slots, Asia, London, and NY AM by default, and every one is fully configurable: name, start time, end time, color, line width, box opacity, and whether the slot draws at all. Rename the NY AM slot to Sydney or Frankfurt if those are the sessions you read; the math and rendering work the same for any window. A separate Max Sessions setting (default 5) controls how many past trading days stay visible on the chart, not the number of distinct session windows.
The Overnight Sessions indicator focuses on overnight range structure, Asia and London ranges, session highs and lows, midpoints. The Intraday Levels indicator tracks prior-day high and low, daily pivots, weekly levels, and ADR projections. They cover different layers of the same map. Most traders who buy one end up running both.
It draws the 50% level of each session's range. Price often reverts to this level during low-volume drift, and it makes a clean mean-reversion reference when a session closes with a wide range and price opens inside it.
Any instrument NT8 can chart with real Globex data, ES, MES, NQ, MNQ, YM, RTY, CL, GC, 6E, and most overnight-liquid futures. Any market without real overnight volume (some equities, thin contracts) will produce empty sessions; the indicator respects the actual time windows regardless of volume.
Yes, every edition, Free NT8, NT8 Lifetime License, and every tier in between. The only requirement is NinjaTrader 8 version 8.1.7 or newer. The indicator authenticates through NinjaTrader's email-based licensing, which needs a current build; older versions can't authenticate. Update via NT8's Control Center → Help → Check for Updates first if you're on an earlier version.
Yes, anywhere you sign in to NinjaTrader 8 with your user email. The license is tied to your NT8 user, not the machine, so desktop, laptop, and VPS all work the same. One user, unlimited machines.
Yes, lifetime updates. Every new version is free forever. If you buy the Complete Bundle, every future indicator I ship is also included at no extra cost.
Indicators are non-refundable, once you download, the software is yours to keep. Two ways to de-risk before buying: (a) try any of the free indicators first to confirm they load and run on your setup, and (b) email me with any pre-purchase questions at info@steady-turtle.com.
Every knob,
exposed.
Every session, every color, every time window, all configurable. Here's what ships in the settings panel, and what each control does.
Name
Default
What it does
Extend Lines Until (ET)
17:00
Session high/low extension lines stop drawing after this time. Default ends at the RTH close.
Show Live Session
True
Draws the session box and lines while a session is still in progress. Disable for cleaner charts during open sessions.
Extend Lines
True
Extends session high/low lines to Extend Until. Disable to keep lines pinned to the session end.
Show Midpoints
True
Draws a line at the 50% level of each session range, the mean-reversion reference.
Show Labels
True
Show session name + level labels at the right edge of each extension line.
Max Sessions
5
How many past trading days stay on the chart. With the default 5, you see the last five days of session boxes; older days get cleared as new ones come in. Not the number of distinct session windows, that is fixed at three slots.
Broken Line Opacity
30
Opacity (1-100) applied to session High/Low lines once a bar closes through them. Set to 100 to disable the dim-on-break effect. Midpoints are unaffected.
Session 1 Name
Asia
Display label for Session 1.
Session 1 Show
True
Whether to draw Session 1 at all.
Session 1 Start (ET)
19:00
Session 1 start time in Eastern Time.
Session 1 End (ET)
03:00
Session 1 end time in Eastern Time.
Session 1 Color
DeepPink
Session 1 line and box color.
Session 1 Line Width
2
Session 1 extension-line width (1-10).
Session 1 Box Opacity
10
Session 1 box fill opacity (1-100).
Session 2 Name
London
Display label for Session 2.
Session 2 Show
True
Whether to draw Session 2 at all.
Session 2 Start (ET)
03:00
Session 2 start time in Eastern Time.
Session 2 End (ET)
09:00
Session 2 end time in Eastern Time.
Session 2 Color
RoyalBlue
Session 2 line and box color.
Session 2 Line Width
2
Session 2 extension-line width (1-10).
Session 2 Box Opacity
10
Session 2 box fill opacity (1-100).
Session 3 Name
NY AM
Display label for Session 3.
Session 3 Show
True
Whether to draw Session 3 at all.
Session 3 Start (ET)
08:00
Session 3 start time in Eastern Time.
Session 3 End (ET)
12:00
Session 3 end time in Eastern Time.
Session 3 Color
DarkOrange
Session 3 line and box color.
Session 3 Line Width
2
Session 3 extension-line width (1-10).
Session 3 Box Opacity
10
Session 3 box fill opacity (1-100).
Show Price
False
Append numeric price values to session labels at the right edge.
Label Color
Tan
Color for session labels.
Debug Mode
False
Print diagnostic info to the NinjaScript output window. Off unless you are troubleshooting.
While you're hereOften paired with Overnight Sessions
$49 buys the indicator. $299 buys everything, plus every one I ship next year. Either way, one payment, no subscription, and it runs wherever you log into NinjaTrader.
Futures and forex trading contains substantial risk and is not for every investor. An investor could potentially lose all or more than the initial investment. Risk capital is money that can be lost without jeopardizing ones' financial security or life style. Only risk capital should be used for trading and only those with sufficient risk capital should consider trading. Past performance is not necessarily indicative of future results.
Testimonials appearing on this website may not be representative of other clients or customers and is not a guarantee of future performance or success.
Hypothetical Performance Disclosure
Hypothetical performance results have many inherent limitations, some of which are described below. No representation is being made that any account will or is likely to achieve profits or losses similar to those shown; in fact, there are frequently sharp differences between hypothetical performance results and the actual results subsequently achieved by any particular trading program. One of the limitations of hypothetical performance results is that they are generally prepared with the benefit of hindsight. In addition, hypothetical trading does not involve financial risk, and no hypothetical trading record can completely account for the impact of financial risk of actual trading. For example, the ability to withstand losses or to adhere to a particular trading program in spite of trading losses are material points which can also adversely affect actual trading results. There are numerous other factors related to the markets in general or to the implementation of any specific trading program which cannot be fully accounted for in the preparation of hypothetical performance results and all which can adversely affect trading results.