Steady Turtle Steady Turtle Trading Futures · NinjaTrader 8 · Est. 2021
4.8/5 1,200+ futures traders
NinjaTrader 8 ES & NQ Futures ICT / SMC · Free

Where price moved too fast, boxed.

One-Time Purchase Lifetime Updates NinjaTrader 8

A fair value gap is a three-candle imbalance — a pocket of air the market left behind when price moved too fast to fill every order on the way. This free indicator finds every one on your chart and draws the box automatically. When you outgrow the basics, the Inverse FVG picks up where this leaves off.

ES 06-26
1m 5m 15m RTH
O 5648.25 · H 5671.00 · L 5644.50 · C 5663.75
RETEST · HOLDS
NinjaTrader 8 Workspace · Fair Value Gap (Free) Loaded CME Globex · Live
§ 01 · The Mechanic The idea, in one page

Three candles. One gap.

A bullish FVG is any three consecutive candles where the low of the third is above the high of the first — the market rallied so hard that the middle candle’s body skipped right past a price zone no one traded in. A bearish FVG is the same pattern inverted. That empty zone is the gap. The indicator watches every bar, measures every three-candle sequence, and draws a box when one qualifies.

① THREE CANDLES ② C1 HIGH · C3 LOW ③ ONE GAP C1 HIGH C3 LOW FVG C1 C2 C3
§ 02 · On Real Charts Evidence, not marketing

The gaps, in practice.

Three MNQ sessions — one bearish cap, an hour-long trend that left four bullish gaps, and a single launch candle that left three.

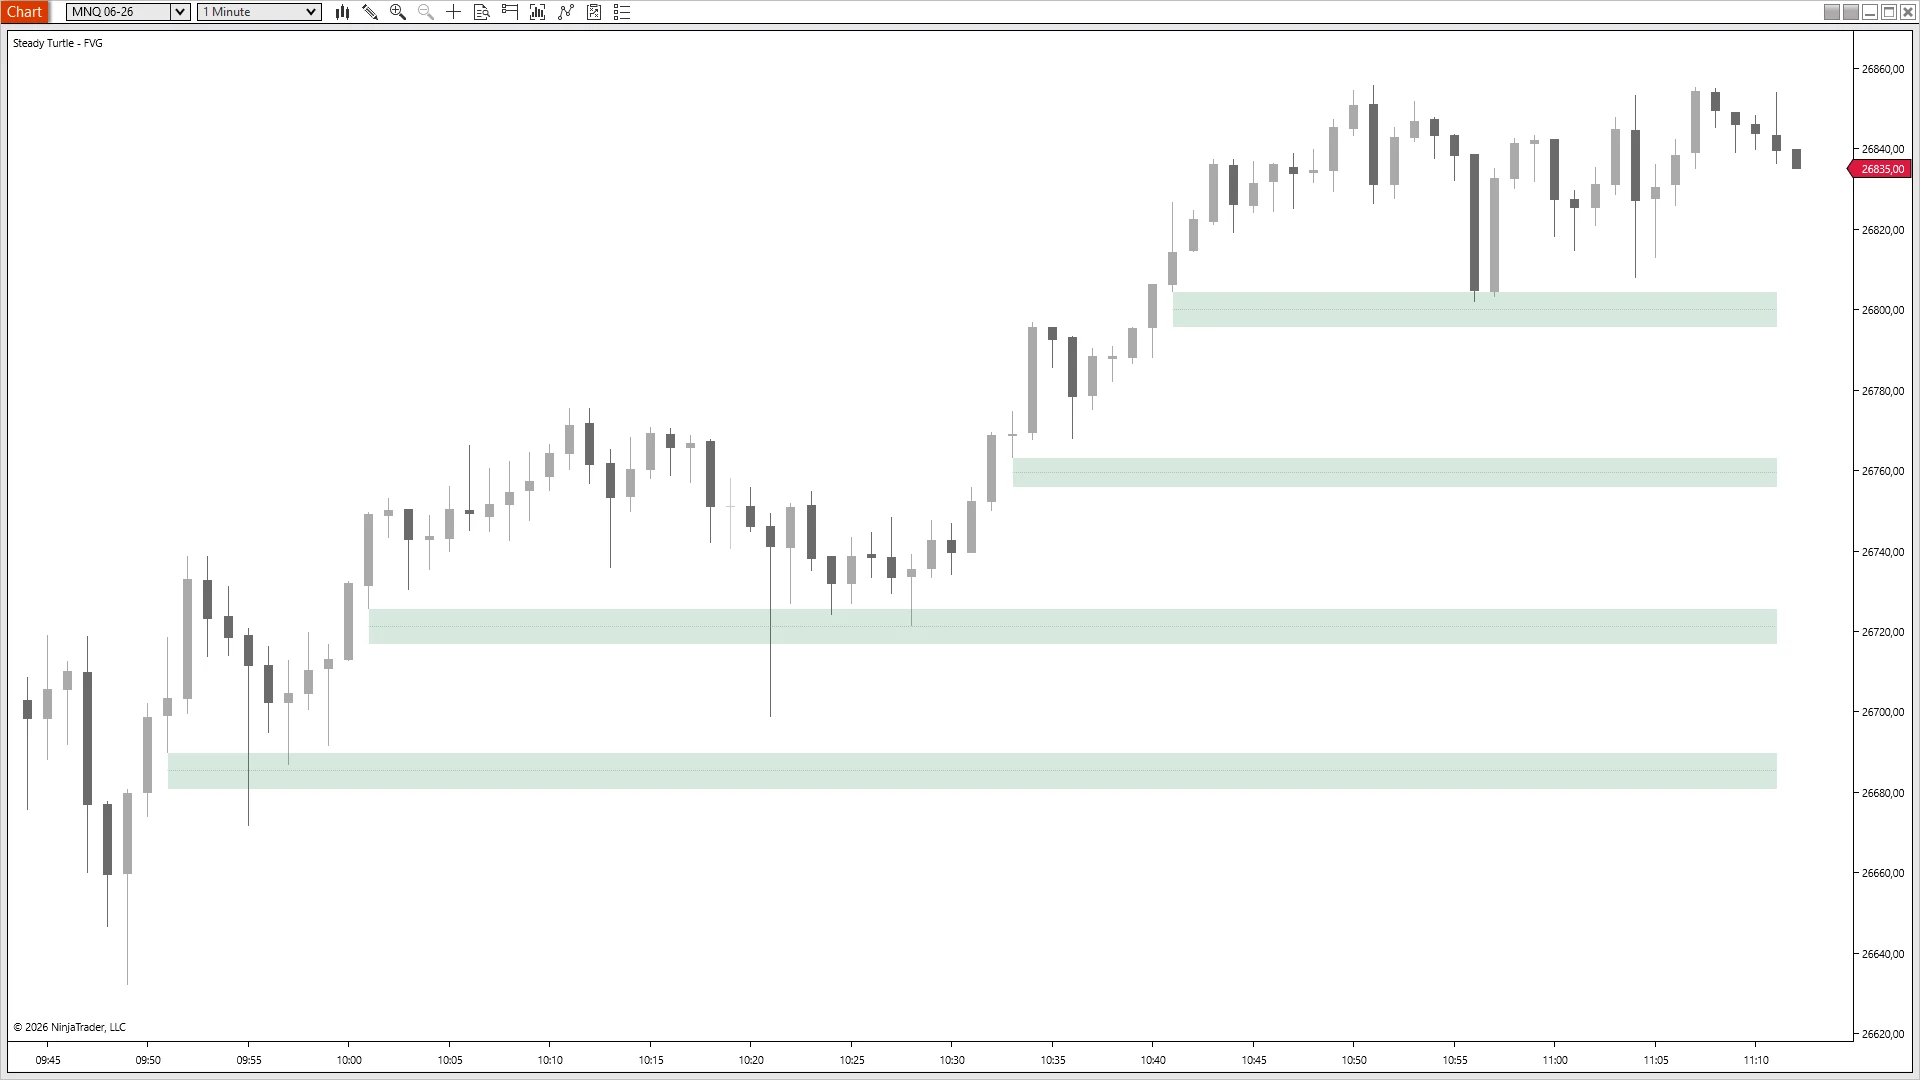
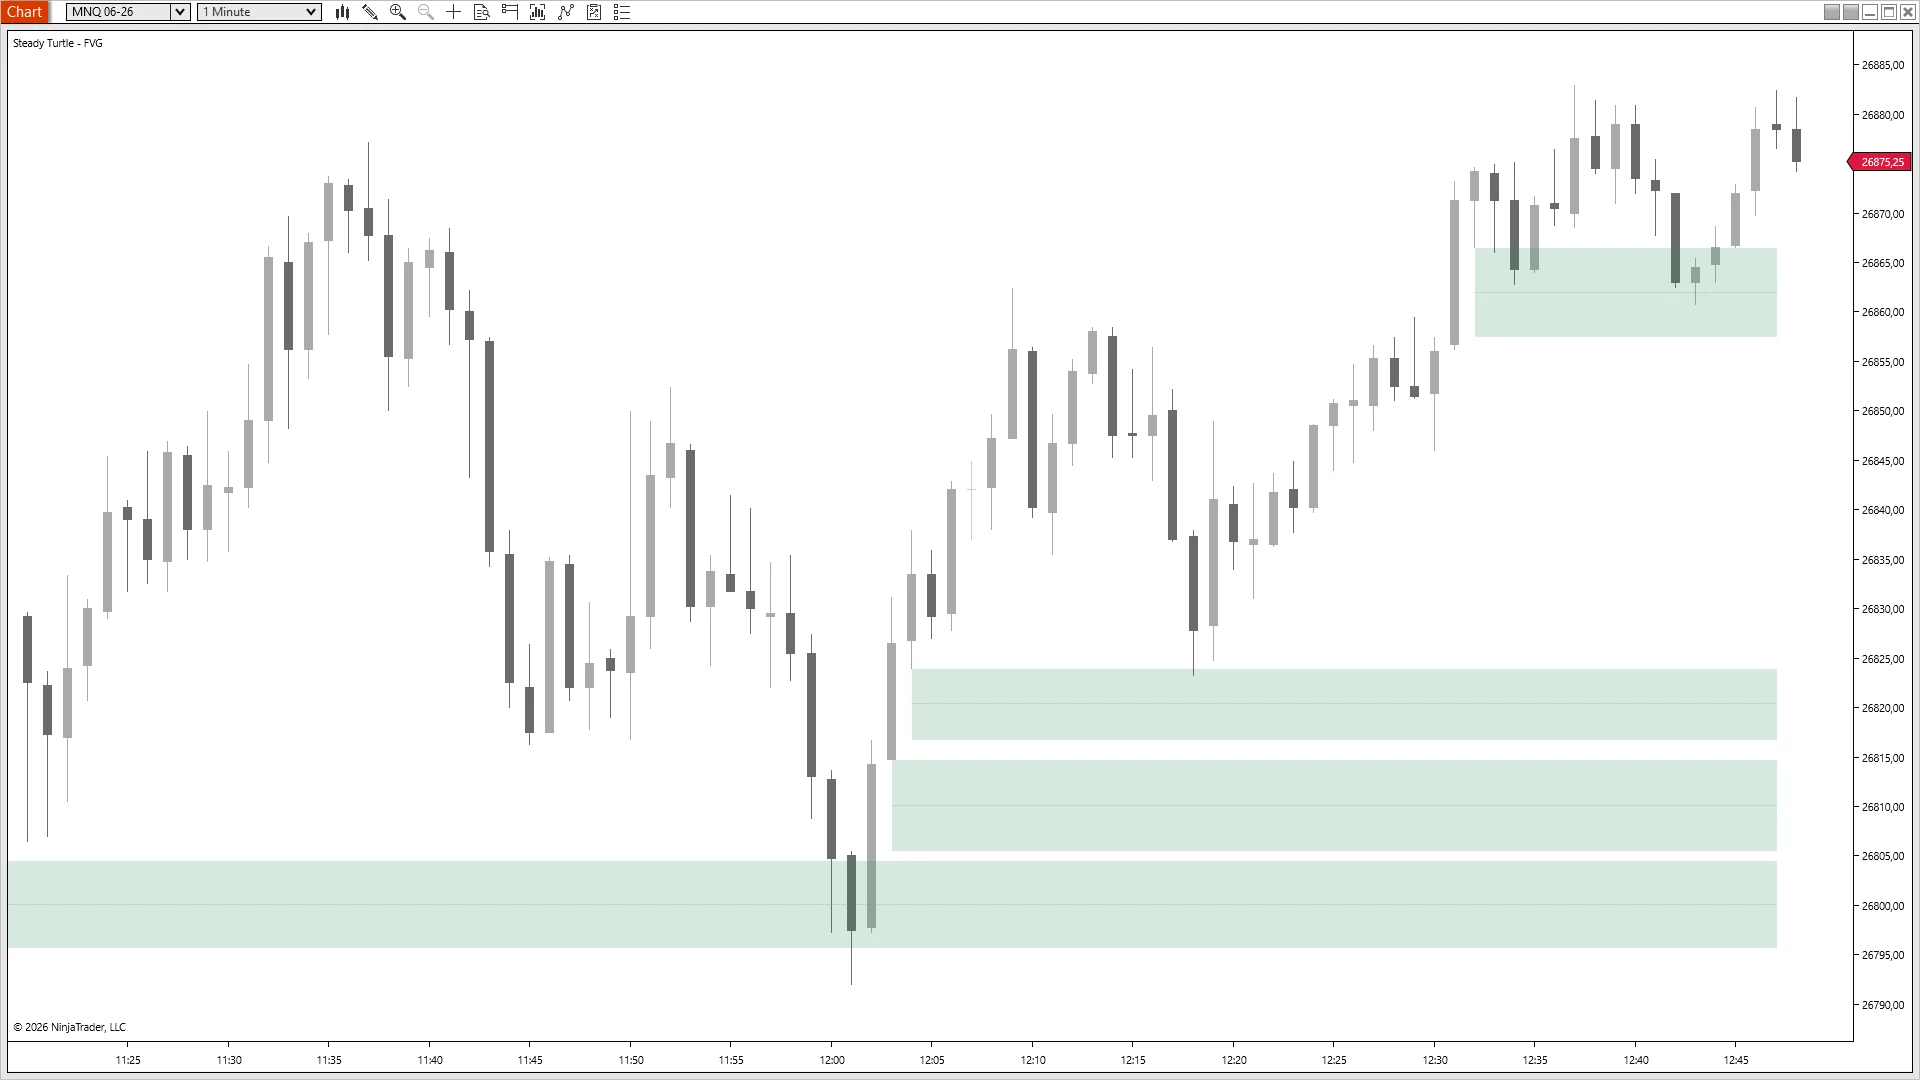
MNQ 06-26 · Globex · 1m

The bearish gap that capped.

A bearish Fair Value Gap on MNQ at 26476–26482 acting as a clean ceiling — price wicks into the bottom three times, never closes above, and rolls 30 points lower

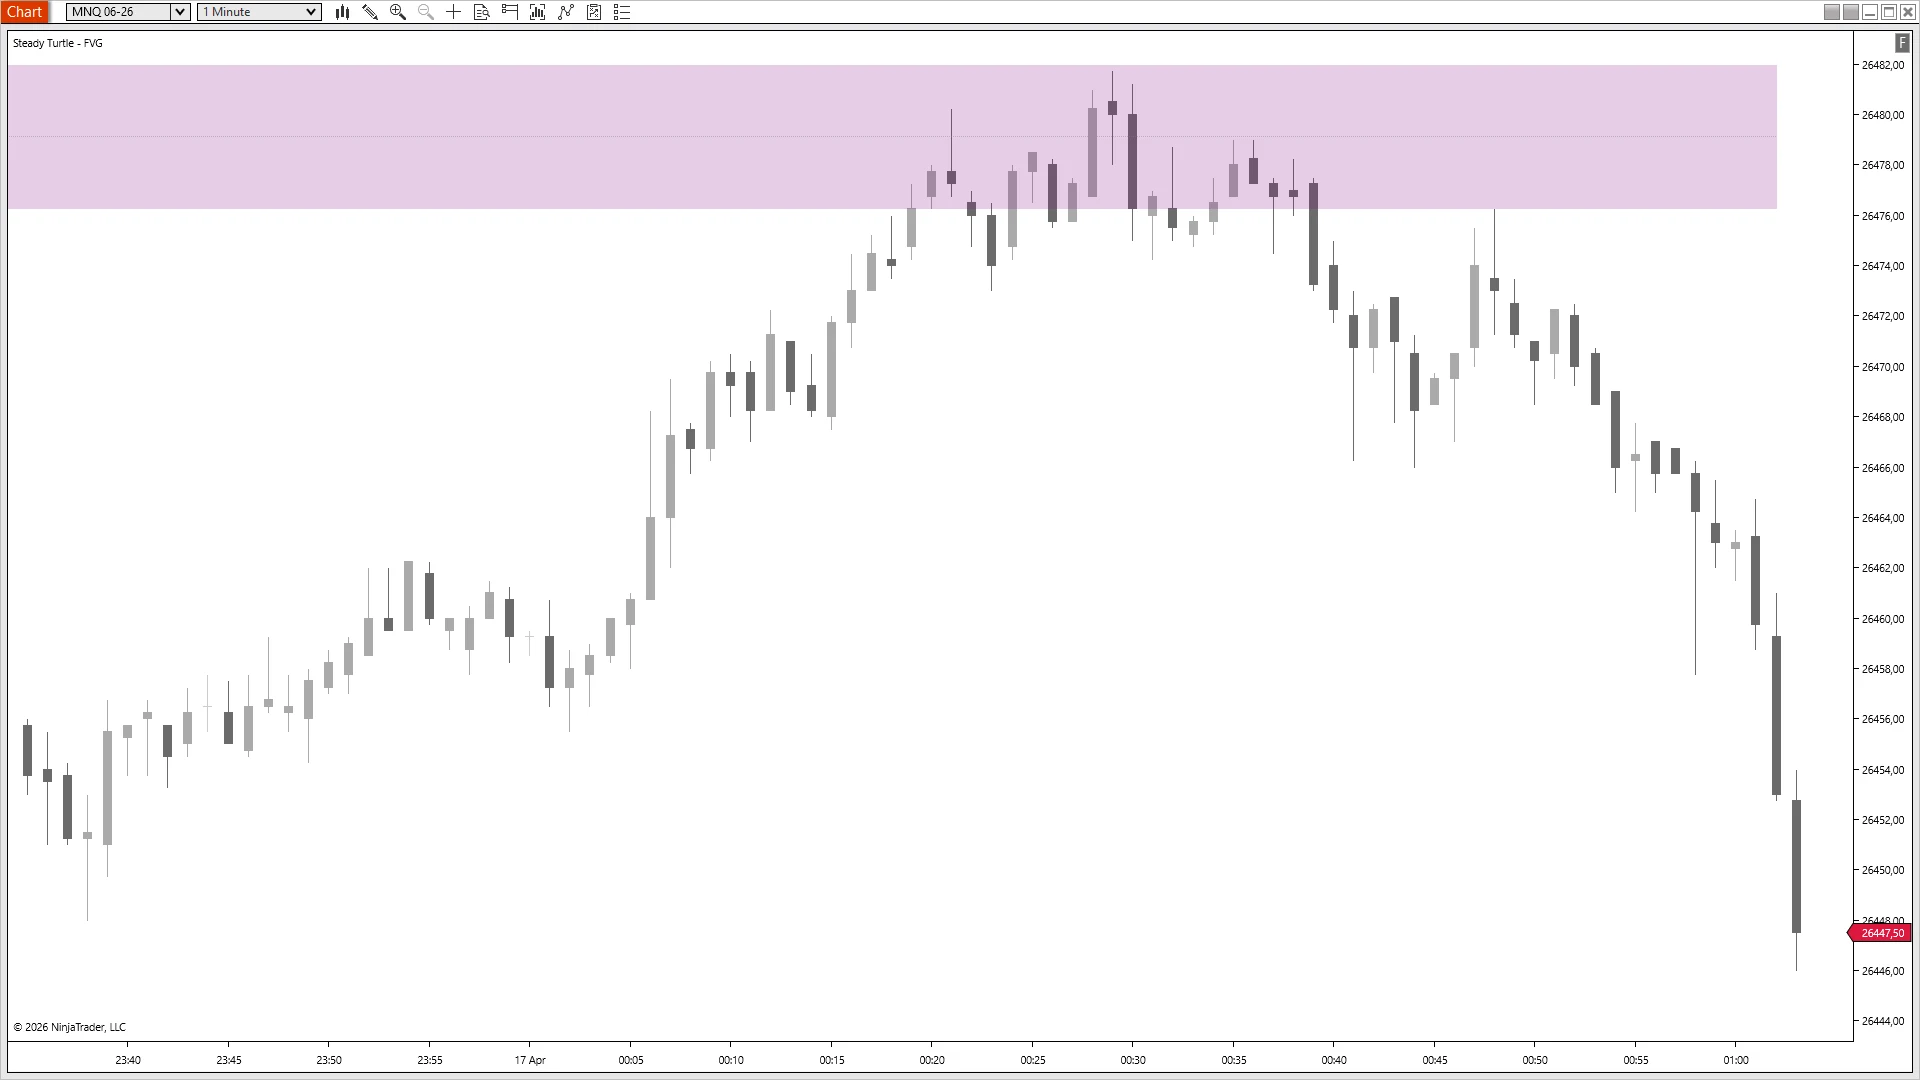
Three wicks in, no closes through.

A bearish FVG draws at 26476–26482 from a sharp earlier drop. Price spends twenty minutes climbing back up to the box and probes the bottom edge three times in a row — 00:20, 00:25, 00:35 — wicks in, no closes above. After the third rejection, the move rolls and price drops to 26447 over the next half hour. The zone capped the entire session; the indicator drew it the moment the gap formed, before any of the tests happened.

MNQ 06-26 · RTH · 1m

Trend day, every gap drawn.

A trending MNQ uptrend that left four stacked bullish Fair Value Gaps across an hour — at 26688, 26720, 26760, and 26800 — with the topmost gap tested as support and held

A trail of footprints, marked in real time.

A one-way uptrend from 26680 to 26840 leaves four bullish FVGs stacked up the chart — 26688, 26720, 26760, and 26800 — one for each push. The indicator marks each box the instant the third candle closes, so the trail builds in real time as the move develops. At 10:55 a wick comes back down to the topmost gap at 26800 and finds support there — the trail also functions as a retest map. This is the indicator's main job in full evidence: every gap, no missed levels, no drawing by hand.

MNQ 06-26 · RTH · 1m

Three gaps, three minutes.

A single launch candle on MNQ at 12:00 leaving three bullish Fair Value Gaps stacked back-to-back — 26795–26805, 26808–26815, 26818–26825 — followed by a 75-point rally with no retest

When the indicator paints back-to-back, the push is real.

The 12:00 reversal candle is so violent it leaves three bullish FVGs stacked in three minutes — 26795–26805, 26808–26815, and 26818–26825. Each one is its own three-bar gap, but the whole stack belongs to a single launch sequence. Price runs from 26800 to 26880 over the next forty-five minutes and never returns to fill any of them. When the box count climbs that fast, you're looking at an explosive push, not a normal trend day — and the indicator marks the signature before the candles tell you.

§ 03 · The Receipts What traders say

What traders actually say.

No curated five-star walls. Three quotes from people running the free tool.

Tried this to see if FVG trading actually works before paying for anything. It does. I’ve been running the free one for two months on ES — I’ll probably upgrade to Inverse FVG soon, but the free one did exactly what it said it would.
— Verified buyer
The cleanest FVG implementation I’ve seen — and it’s free. Most free indicators are messy. This one just draws the box and gets out of the way.
— Verified buyer
Started with the free one. Ran it for three weeks, saw the setup work on my charts, then bought the paid version for the inversion detection. The free tool is the best trial you can have — you use it on your real setup.
— Verified buyer
§ 04 · Download Free · No credit card · No expiry

Free, for as long as you want it.

Drop in an email, I'll send the download link. You're on my newsletter afterwards — one email most months, unsubscribe whenever. No payment, ever.

Fair Value Gap

The starter. Every three-candle gap, boxed.

Free
Forever
  • Bullish & bearish FVG detection
  • Min-size tick filter (basic)
  • Color & opacity settings
  • Works on any NT8 edition, any instrument
  • Inversion detection
  • High-probability filter · 50% midline

Privacy-respected · unsubscribe any time

Editor's Pick

Complete Bundle

All 12 indicators. Inverse FVG included — the tool the free one upgrades into.

$299
One-time
  • All 12 current indicators
  • Every future indicator, free
  • Lifetime updates
  • One user license (works on multiple machines)
  • Priority support
  • One-time payment, no subscriptions

$24.92 per tool · vs $49 à la carte

100% Free Lifetime Updates NT8 8.1.6+ Any instrument
§ 05 · Questions Objection handler

A few things first.

Everything traders ask me before they download. If yours isn't here, email me →.

A three-candle pattern where the middle candle printed a body so large that the low of candle three sits above the high of candle one (bullish) or the high of candle three sits below the low of candle one (bearish). The space between those two wicks is the FVG — a price zone the market moved through without filling orders at every level on the way. ICT traders call it an imbalance; SMC traders call it a fair-value gap. Same thing.
Because FVG trading either works for your setup or it doesn't, and the honest way to find that out is to run the tool on your real charts for a couple of weeks. If it clicks, you'll probably want the Inverse FVG for the inversion detection and the size filters. If it doesn't, you lost nothing. The free tool is the trial.
An email address. You'll land on my newsletter — one email most months, usually with a short research note on intraday probability structure or a build update. Unsubscribe any time; it doesn't disable the indicator.
This free one detects bullish and bearish FVGs with min/max size filters, a midline at the 50% (consequent-encroachment) level, projection-bar extensions, and automatic invalidation when price closes through the gap. The Inverse FVG ($49) adds: inversion detection (when a gap fails, the box flips color to mark the role reversal), a high-probability filter that only shows gaps where the middle candle's body is largest, custom-interval / multi-timeframe detection, and a few ICT-specific modes. The upgrade is the detection layer; this one is the primitive.
Any instrument NT8 can chart. FVGs originated in futures, but the three-candle pattern is price-action-universal — equities, FX, crypto, commodities all produce them. The indicator works on any of those. Defaults are tuned for index futures; adjust the minimum tick filter to taste per instrument.
Any. Day traders on ES/NQ tend to live on 1-minute and 5-minute charts; swing traders use 1-hour and 4-hour; the pattern exists on all of them. Higher timeframes produce fewer but more significant gaps — a 1-hour FVG holds more weight than a 1-minute one. If you're new to FVGs, start on 5-minute — enough prints to see the pattern, not so many that the chart is cluttered.
Yes, every edition — Free NT8, NT8 Lifetime License, and every tier in between. The only requirement is NinjaTrader 8 version 8.1.6 or newer — that's the build where NinjaTrader introduced email-based licensing, which the indicator uses to authenticate. Older builds can't authenticate; update via NT8's Control Center → Help → Check for Updates first if you're on an earlier version.
Yes — anywhere you sign in to NinjaTrader 8 with your user email. The license is tied to your NT8 user, not the machine, so desktop, laptop, and VPS all work the same. One user, unlimited machines.
§ 06 · Settings Reference For the record

Every knob, exposed.

This is the full settings panel for the free version. Deliberately sparse — detection, filtering, and styling. The Inverse FVG adds the rest.

Name Default What it does
Min FVG Size (Ticks) 20 Minimum gap size in ticks before the indicator draws it. Filters out micro-gaps.
Max FVG Size (Ticks) 40 Maximum gap size in ticks. Prevents oversized gaps from noisy bars.
Max Lookback Bars 240 Only show gaps created within the last X bars. Older gaps fade off, keeping the focus on recent setups.
Projection Bars 0 Extend active gaps this many bars into the future. 0 = stop at current bar.
Remove Invalidated Gaps True Remove the gap when price closes through it (above a bearish gap's top or below a bullish gap's bottom).
Bull Color SeaGreen Fill color for bullish FVG boxes.
Bear Color Purple Fill color for bearish FVG boxes.
Box Opacity 20 Transparency of the FVG fill, 1–100. Lower values keep price action readable through the zones.
Show Midline True Draws a line at the 50% level of each FVG — useful reference for partial-fill trades.
Midline Color Gray Color of the 50% midline.
Midline Opacity 40 Transparency of the 50% midline, 1–100.

Start here. Upgrade when it clicks.

The free tool is built to be enough to decide. Run it for a couple of weeks. If FVGs end up on every chart you pull, the Inverse FVG is $49 and the Complete Bundle is $299 — you'll know which makes sense by then.

4.8/5 1,200+ futures traders
FREE · LIFETIME UPDATES · NT8 8.1.6+
Risk Disclosure

Futures and forex trading contains substantial risk and is not for every investor. An investor could potentially lose all or more than the initial investment. Risk capital is money that can be lost without jeopardizing ones' financial security or life style. Only risk capital should be used for trading and only those with sufficient risk capital should consider trading. Past performance is not necessarily indicative of future results.

Testimonials appearing on this website may not be representative of other clients or customers and is not a guarantee of future performance or success.

Hypothetical Performance Disclosure

Hypothetical performance results have many inherent limitations, some of which are described below. No representation is being made that any account will or is likely to achieve profits or losses similar to those shown; in fact, there are frequently sharp differences between hypothetical performance results and the actual results subsequently achieved by any particular trading program. One of the limitations of hypothetical performance results is that they are generally prepared with the benefit of hindsight. In addition, hypothetical trading does not involve financial risk, and no hypothetical trading record can completely account for the impact of financial risk of actual trading. For example, the ability to withstand losses or to adhere to a particular trading program in spite of trading losses are material points which can also adversely affect actual trading results. There are numerous other factors related to the markets in general or to the implementation of any specific trading program which cannot be fully accounted for in the preparation of hypothetical performance results and all which can adversely affect trading results.