01 · The daily-level sweep and reversal
Price sweeps the prior day's high or low, takes out the stops resting just beyond it, and reverses. One of the highest-frequency setups on ES, and one of the cleanest to trade when the indicators agree.
- ·Entry: on the rejection candle after price pokes through yesterday's high/low, or a limit at the level itself for the next retest.
- ·Stop: just beyond the swept high/low. Invalidation is clean: a close back above the level means the sweep was real.
- ·Target: VWAP for a first partial, the session POC or opposite extreme for the runner.
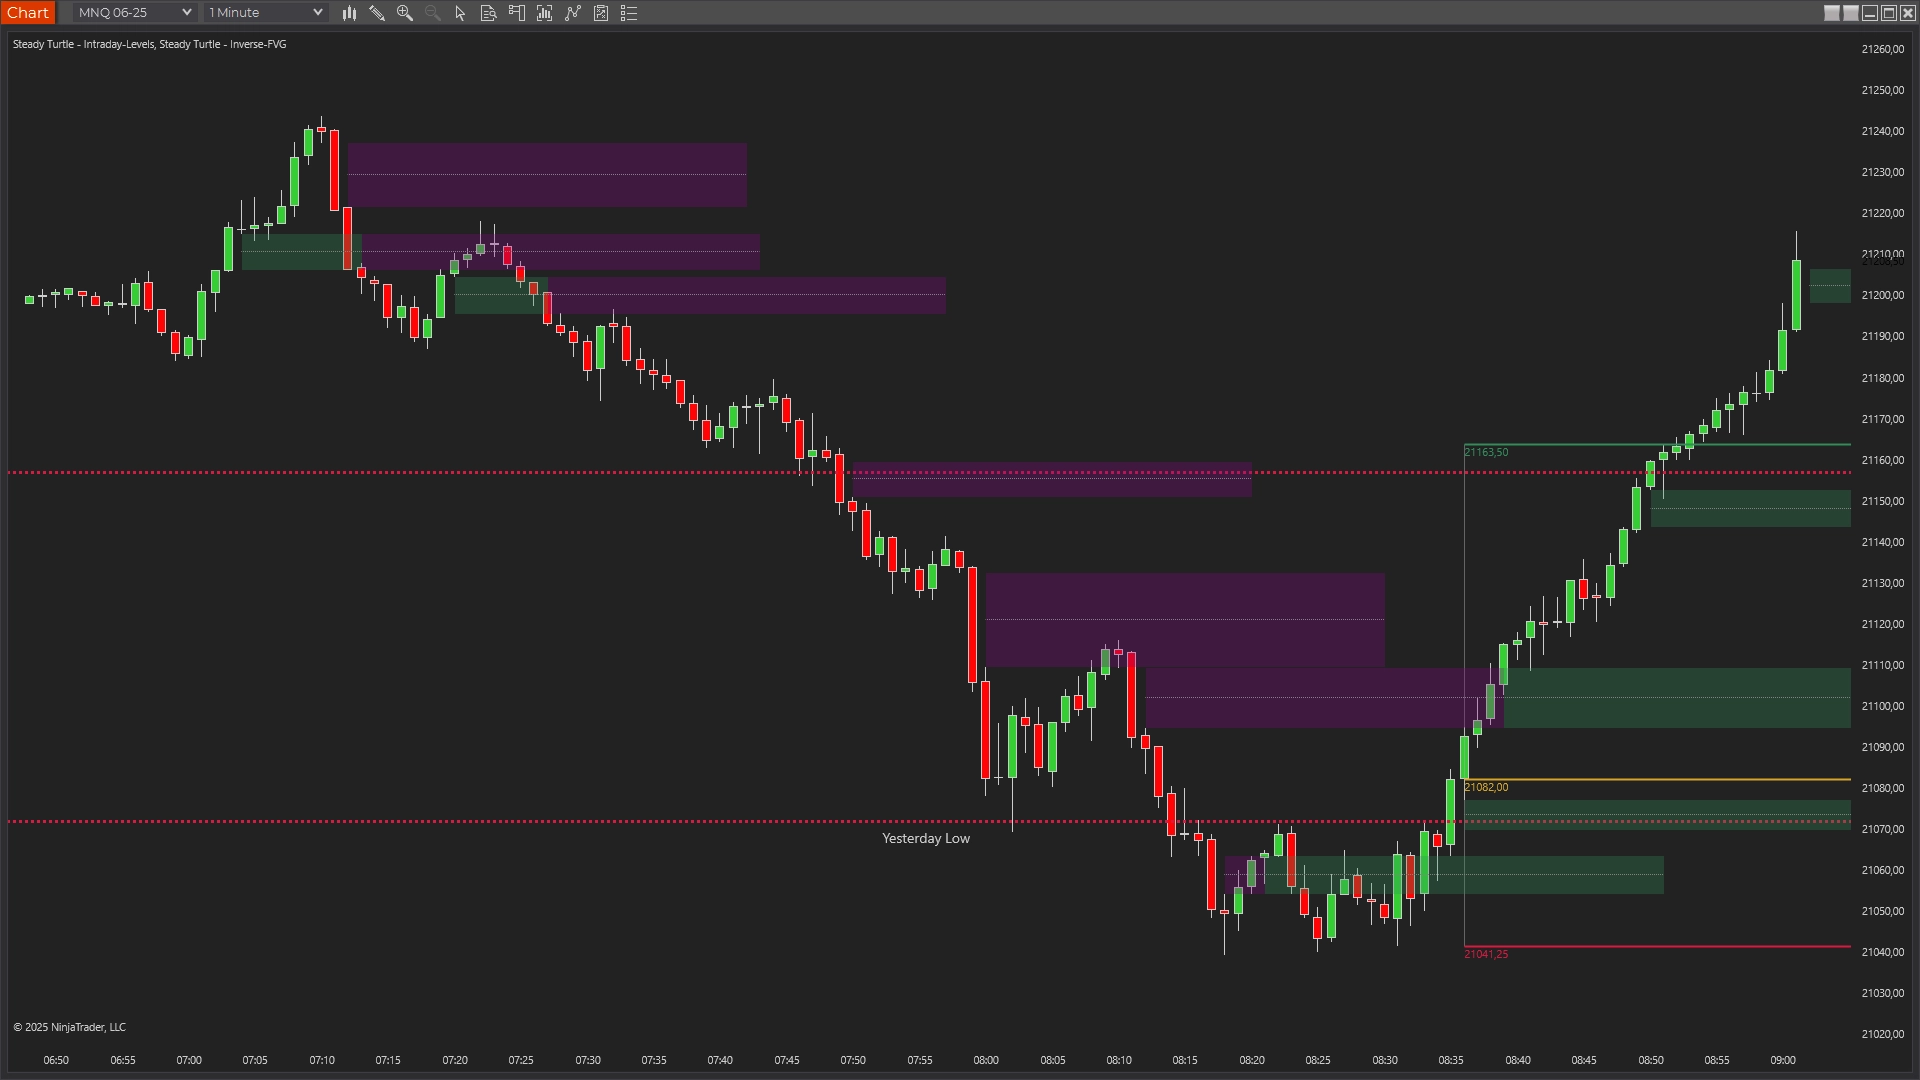
- Prior-day low sits at 21,070.
- Price spikes to 21,040, grabbing the stops below, then immediately reclaims 21,080.
- A strong green candle closes back above 21,070 and prints a fresh bullish FVG on the reclaim.
- Enter long 21,080, stop 21,035 (below the sweep low), first partial at VWAP near 21,150, runner to the session POC.
Why it works: institutions sweep obvious levels to fill size against the stops parked there. Once that liquidity is taken, the reversal is fast and forceful because the traders who were run are now trapped on the wrong side.
Intraday Key Levels
Plots the prior day's H/L automatically, you're not eyeballing the level, it's drawn before the session opens.
See the Intraday Key Levels indicator →02 · VWAP bounce in a trending session
On a clean trend day price repeatedly pulls back to the session VWAP before continuing in the trend direction. The pullback-to-VWAP trade is one of the highest-probability continuations on the tape.
- ·Entry: first rejection candle off VWAP, in the trend direction.
- ·Stop: beyond the VWAP rejection point, small enough that R:R is at least 2:1 to the next level.
- ·Target: the next ±1σ band, or the session extreme.
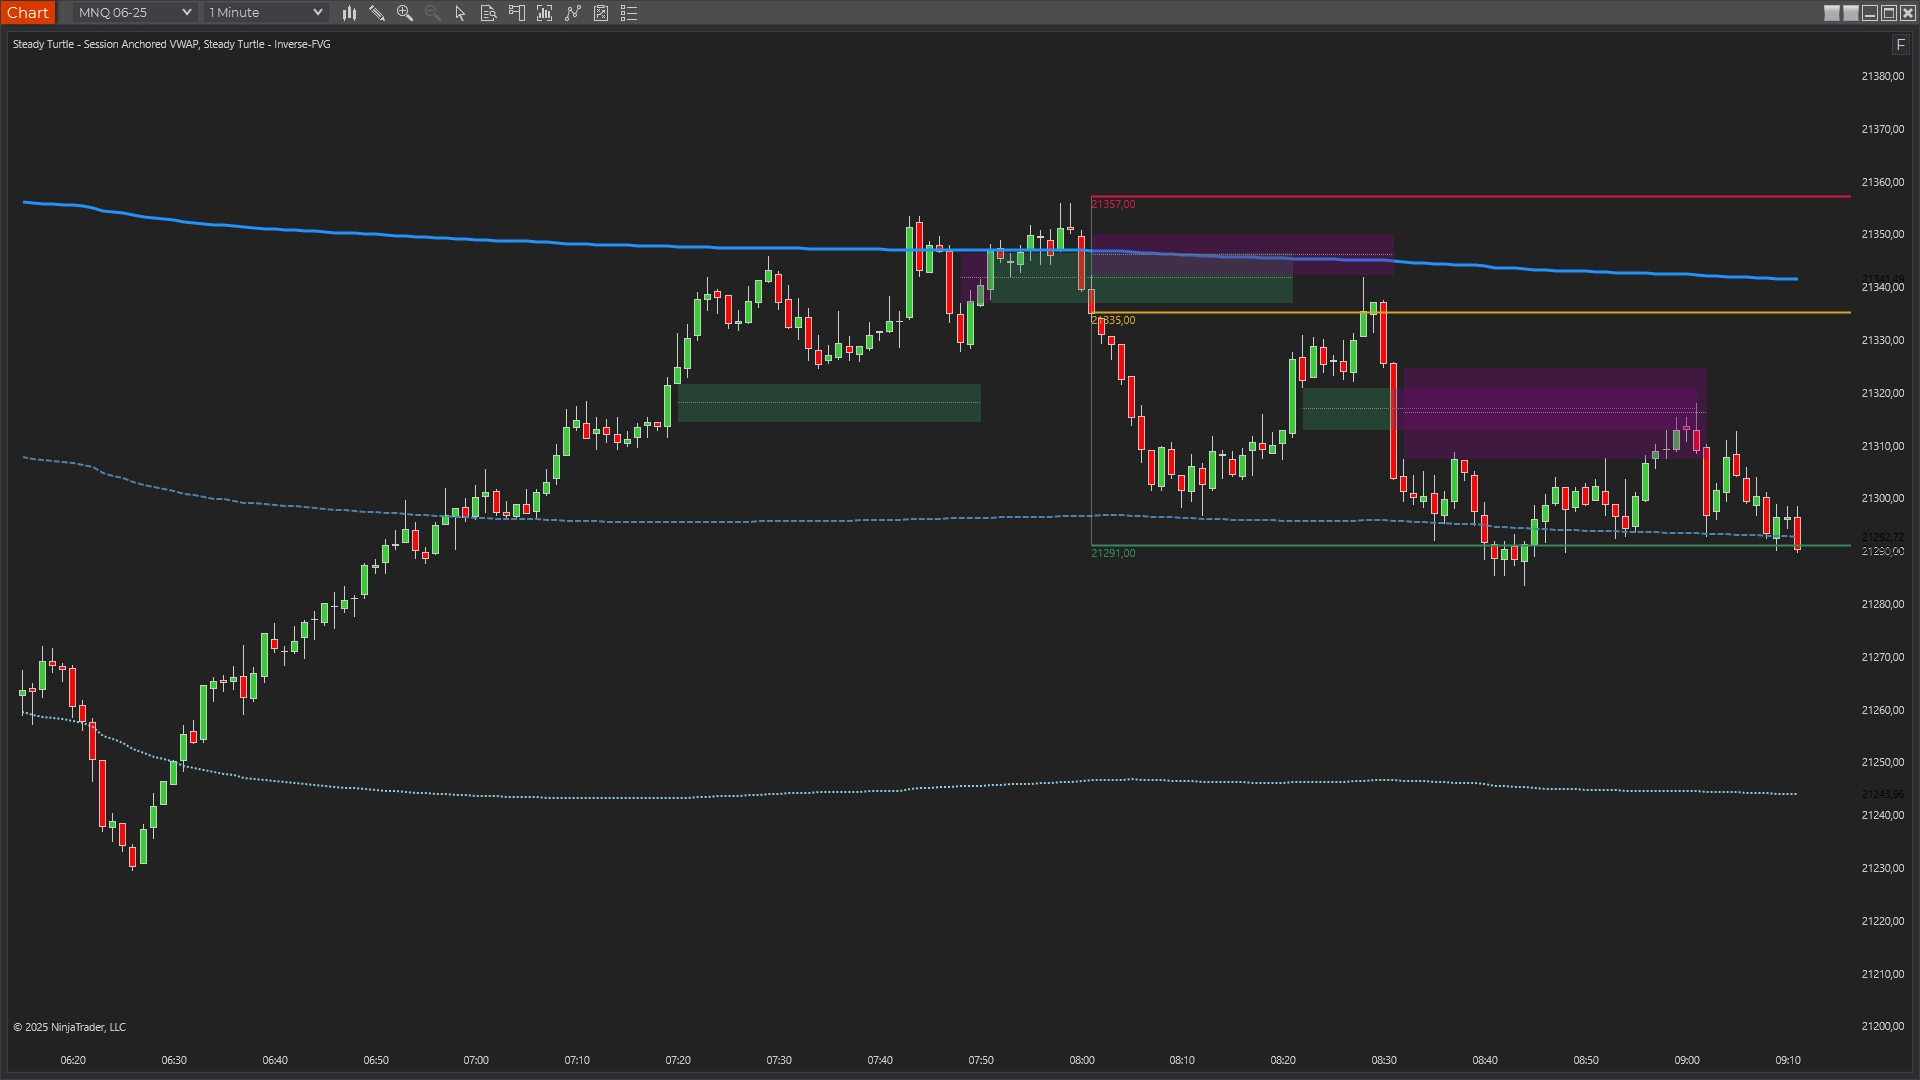
- NQ is trending down; the session VWAP sits overhead at 21,350.
- Price pulls back up into VWAP, tags 21,352, and stalls.
- A bearish rejection candle, long upper wick, closes back below VWAP.
- Enter short 21,335, stop 21,368 (above the VWAP tag), first partial at the −1σ band, runner to the session low.
Why it works: VWAP is the session's institutional fair value. In a trend, the side in control defends it, so pullbacks into VWAP are exactly where big money re-loads in the trend direction rather than fights it.
Session VWAP
Session-Anchored VWAP with ±σ bands, the anchor point and the target zones in one tool.
See the Session VWAP indicator →03 · Initial Balance extension
The first 60 minutes of regular trading, 09:30 to 10:30 ET, define the Initial Balance. A break of the IB high or low with momentum often extends to 1.5× or 2× the IB range. Direct, measurable, and the targets are set before the entry. This is the intraday expression of the full Initial Balance trading strategy, the first-hour range, the break, and the extension ladder.
- ·Entry: close above IB high / below IB low on elevated volume.
- ·Stop: back inside the IB range.
- ·Targets: 1× IB extension for a first partial, 2× for the runner. 3× on very strong days.
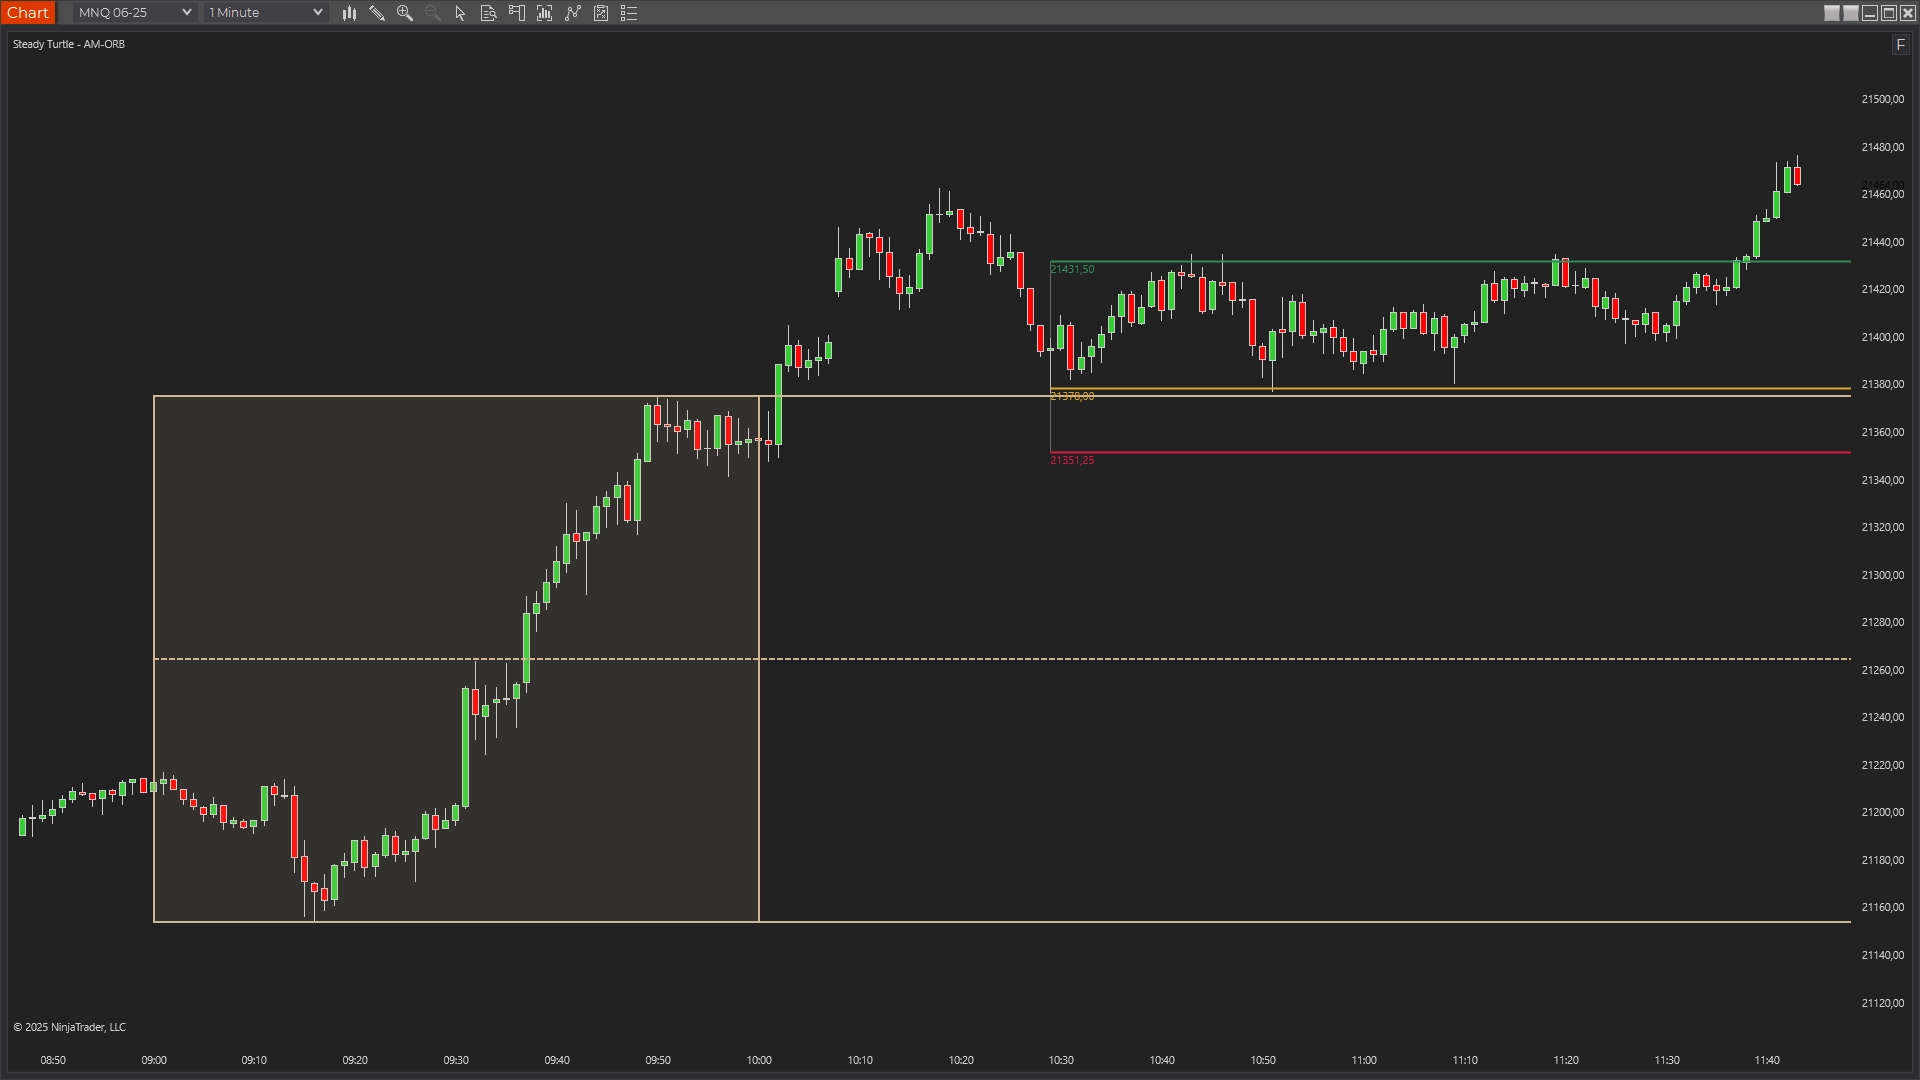
- By 10:30 ET the IB has printed a low of 21,180 and a high of 21,260, an 80-point range.
- At 10:42 a bar closes above 21,260 on visibly heavier volume than the inside-range bars before it.
- Enter long 21,265, stop back inside the range at 21,225.
- First partial at the 1× extension (21,340), runner to the 2× extension (21,420) while momentum holds.
Why it works: the first hour is where the day's largest institutional flow sets the range. A decisive break on volume says one side has won the morning auction, and the extensions are empirically where trend days travel from there.
Initial Balance
Draws the IB range and projects the 1×/2×/3× extension levels live, the targets are on the chart before the entry is taken.
See the Initial Balance indicator →04 · The triple-confluence setup
The highest-probability of the six. Three independent references agree at the same price: a structural level (pivot, IB edge, prior-day high/low), a volume reference (POC or Value Area boundary), and an order-flow confirmation (delta imbalance or FVG retest).
When all three agree, the setup is almost self-executing, you're not making a judgement call, you're waiting for the conditions to stack. When they don't agree, skip the session. These trades don't print every day; when they do, size up.
- The prior-day high sits at 21,410, the structural reference.
- Session VWAP has risen to 21,408, the fair-value reference, right into the same zone.
- An unfilled bearish FVG from the overnight session covers 21,405-21,415, the order-flow reference.
- Price rallies into 21,410 where all three stack; the Delta Profile shows sellers aggressing at the level.
- Enter short 21,408, stop 21,430 (above the clustered references), first partial 1R, runner into the low-volume void below toward the session POC.
Why it works: one reference can be coincidence. Three independent frameworks pointing at the same price is institutions from different mandates all defending the same level. The agreement is the edge, not any single line.
05 · FVG retest with delta confirmation
A bullish or bearish Fair Value Gap forms during an impulsive move. Price retraces to the gap; at the retest, the Delta Profile shows aggressive buying (at a bullish retest) or aggressive selling (at a bearish retest). The combination, geometric level plus aggressive-flow confirmation, is significantly more reliable than either alone.
- ·Entry: inside the gap on the delta-confirmed rejection.
- ·Stop: beyond the gap's far edge.
- ·Target: next liquidity level in the trend direction.
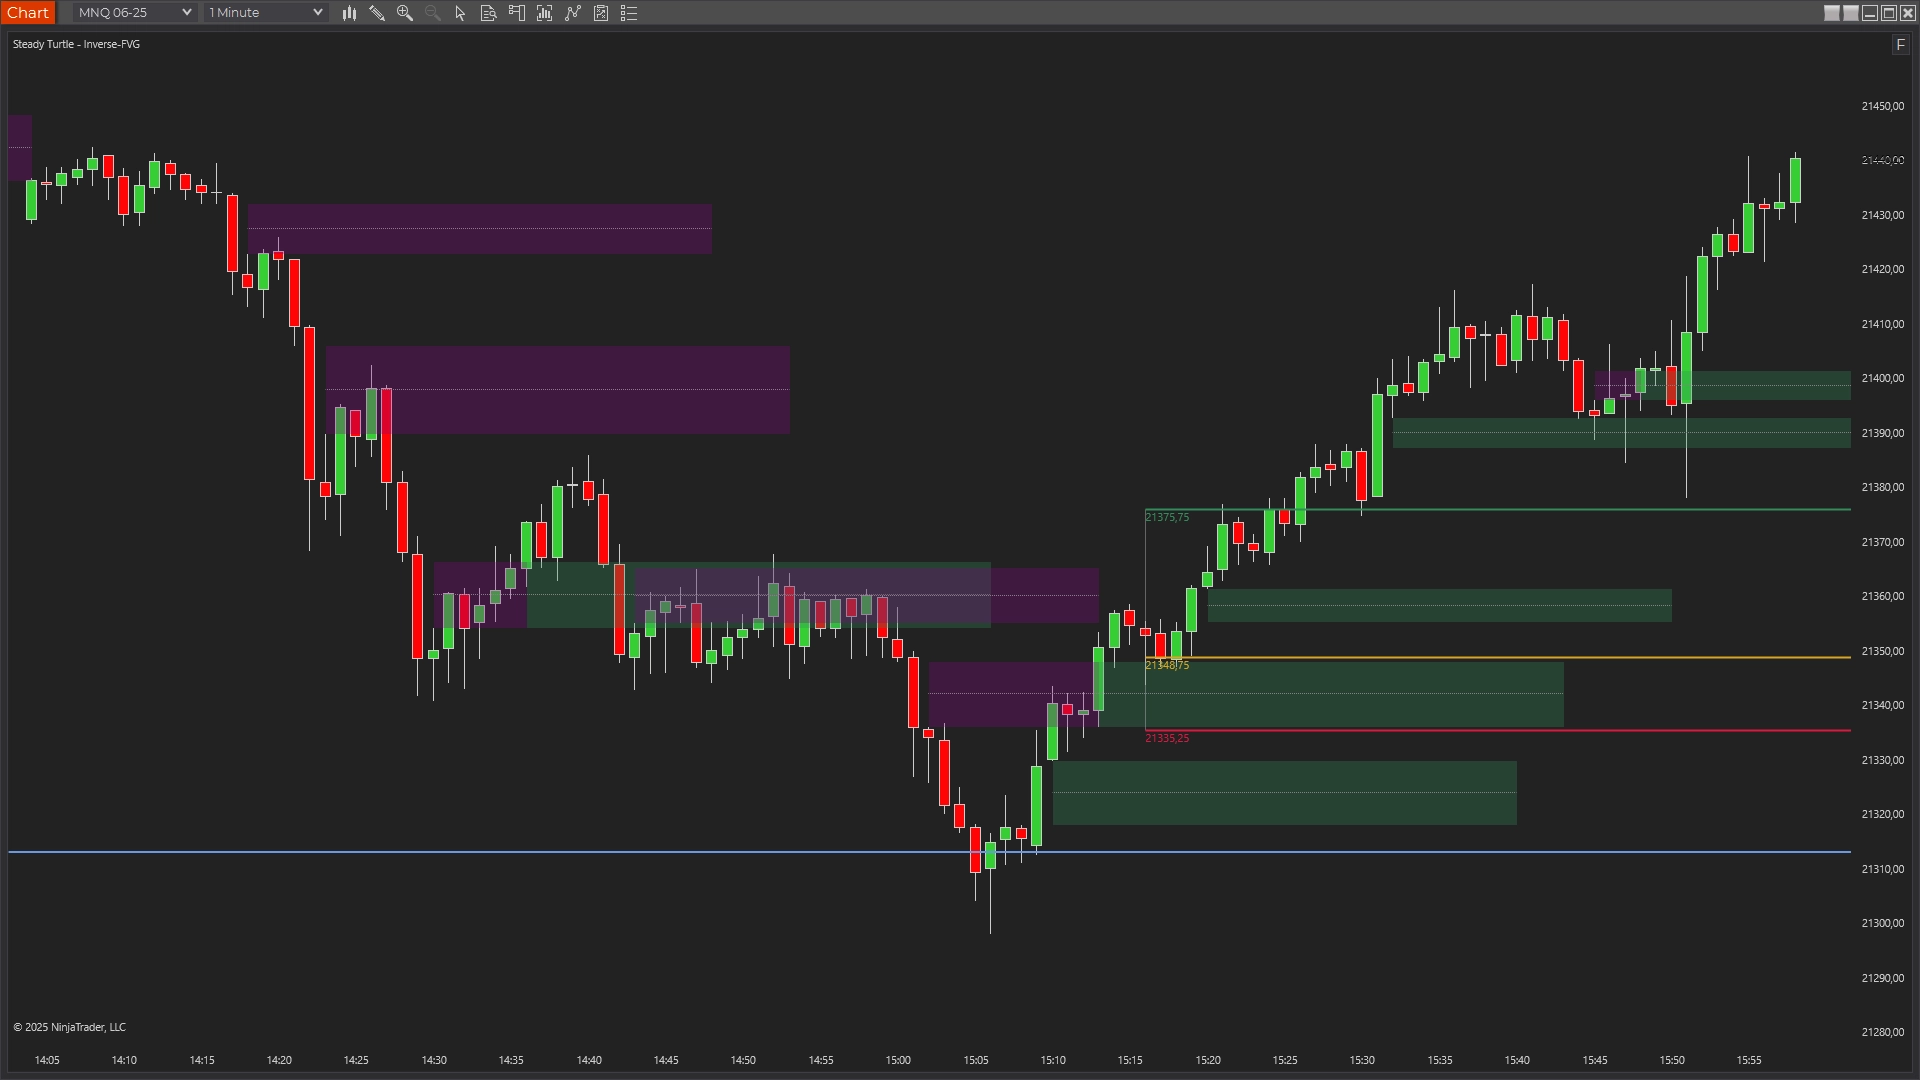
- Price sweeps a key level near 21,315 and reclaims it, printing a fresh bullish FVG on the impulse up.
- Price retraces into the gap; the Delta Profile shows aggressive buying stacking at the retest.
- A prior bearish FVG inverts on the same candle, the zone flips from red to green as its role reverses.
- Enter long 21,350 on the delta-confirmed rejection inside the gap, stop 21,320 (below the gap's far edge), target the next liquidity level in the trend.
Why it works: a gap is a geometric imbalance; a gap defended by aggressive delta is a geometric imbalance the aggressors are actively protecting. Geometry plus flow beats geometry alone.
Delta Profile
Net delta per price level, the aggressive-flow read that tells you whether the retest is being defended.
See the Delta Profile indicator →06 · Opening Range fade
When the first-five-minute Opening Range breaks but fails, price pokes through the OR high or low, fails to hold, and closes back inside, a strong fade setup forms. The failed-breakout reverse is often the highest-odds trade of the first thirty minutes, and the other half of the Opening Range Breakout strategy.
- ·Entry: on the close back inside the OR.
- ·Stop: just beyond the OR extreme that failed.
- ·Target: the opposite OR boundary or VWAP.
- The 09:30-09:35 ET Opening Range prints a low of 21,300 and a high of 21,340.
- At 09:48 price pokes to 21,352, above the OR high, but can't hold there.
- The next bar closes back inside the range at 21,332.
- Enter short 21,330 on the close-back-inside, stop 21,356 (just beyond the failed high), target the opposite OR boundary at 21,300 with VWAP as a first partial.
Why it works: a break that fails is usually a liquidity run. Resting stops just past the OR extreme get swept, and once that flow is absorbed the real move runs the other way.
Opening Range
Draws the five-minute Opening Range and the half-back, the failed-breakout is visible the instant the close-back-inside prints.
See the Opening Range indicator →What the six have in common
They all share the same shape: a specific level, a specific entry trigger, a tight invalidation, and a measurable target. They all need an indicator to make the level visible in real time, none of them works if you're drawing the references after the fact. And they all work better on ES and NQ during RTH than on any other instrument at any other time.
Pick one. Run it for a month. Grade yourself on adherence, not P&L. Add the next one only when the first feels boring.
Risk management, in numbers
Every setup above shares the same risk frame. The setups differ; the money management doesn't. Run this checklist before every entry:
- ·Trend aligned on the higher timeframe.
- ·Inside the high-volume window, roughly 08:00 to 16:00 ET.
- ·A clear, named signal, one of the six, not a feeling.
- ·Risk capped at 1% of the account on the trade.
- ·At least 2:1 reward-to-risk on the full plan, partials along the way manage risk, the final target pays for it.
And the hard rules that don't flex:
1% per trade, max
Never risk more than one percent of the account on a single idea. Position size follows the stop, not the other way around.
Stop set before entry
The invalidation is defined before the order goes in. No moving it wider to avoid being wrong.
ES: stop follows the level
No fixed point count, the stop sits just past the invalidation. At current prices that's roughly 3-10 points on ES.
NQ: stop follows the level
Same rule, wider instrument, roughly 20-45 points on NQ at current prices. Size the position to the stop, never the stop to a target size.
2:1 minimum on the full plan
The final target needs to be at least twice the risk. Partials along the way can be tighter, they're for managing the trade, not for justifying it.
Max 3 trades per day
A hard cap keeps a bad morning from becoming a bad month. Three clean setups beat thirty forced ones.
Before you risk a dollar
None of these setups is worth trading live until it's boring on replay. NinjaTrader's Market Replay lets you run months of tape at your own speed, take a hundred reps of one setup before the first live click. Journal every trade with the setup name, the entry trigger, and whether you followed the rule or improvised; grade adherence, not P&L.
Stay on the simulator until the numbers are consistent, then size up in the smallest increment the market allows. CME micros, MES and MNQ, exist precisely so you can trade real money at a fraction of the risk while the process hardens. One micro contract puts the exact setups above in front of you for a few hundred dollars of margin, not a few thousand.